New trends for a large number of food products: The 2024 best-selling items ranking
2024 is almost drawing to a close. What sold well this year? Let’s take a look back at what sold particularly well amidst daily consumer goods offers using SRI+® (Nationwide Retail Store Panel Survey), retail store sales data collected from approximately 6,000 stores nationwide across Japan.
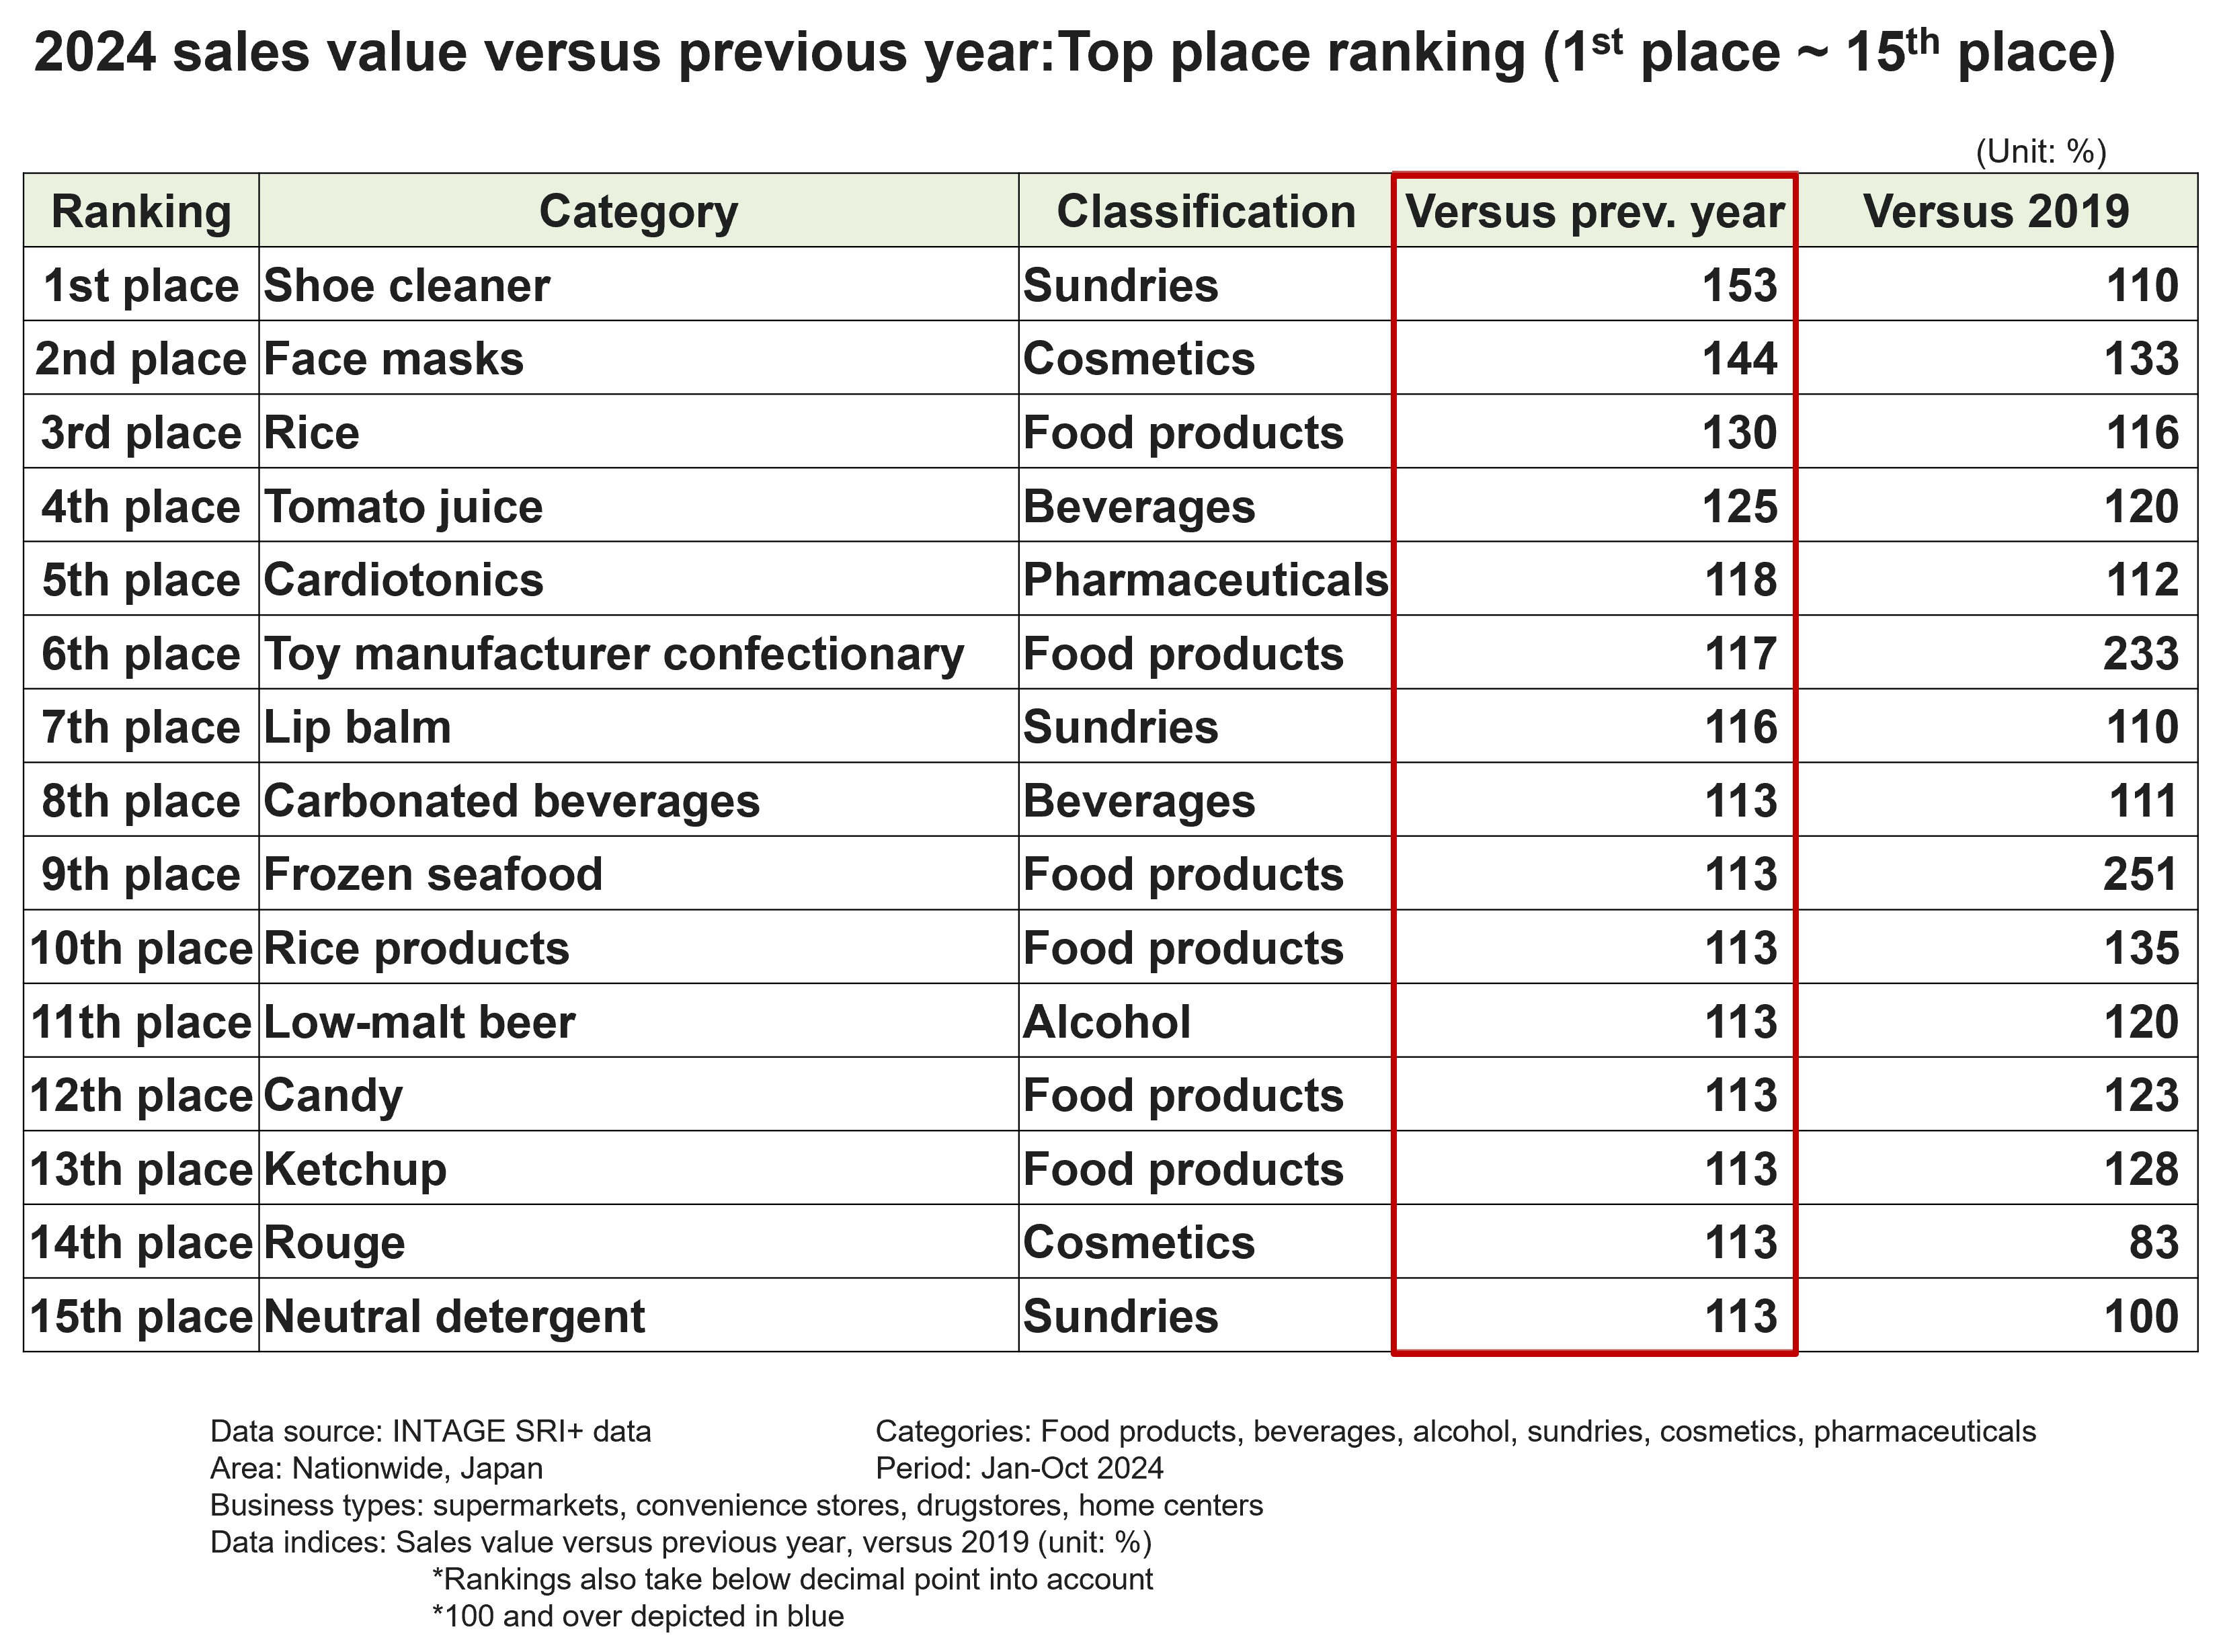
1st place shoe cleaner is 1.5 times higher, and 2nd place face masks are 1.4 higher than last year
Post-Covid, Japan was hit by price rises and oppressive heat in 2024. Amidst this status quo, shoe cleaner ranked 1st (Fig. 1).
Fig. 1
Within this category, sheet type shoe cleaner for sneakers had been selling well from the beginning of the year, but climbed to nearly double the same month in the previous year in June to September amidst the oppressive heat. Shoe cleaner thus overtook face masks, the top item in the first half of the year to rate 153%, and achieve a strong 1st place. 2nd place face masks (144%) rapidly jumped from 15th place last year. Their sales value has sizably exceeded pre-covid levels mainly due to large volume products, the expansion into the market of Korean cosmetics, and a boom driven by famous celebrities. Neither of these products were in the top 10 best-selling item rankings from the outbreak of the covid crisis in 2020 onward, and have appeared as new trends.
Rice ranked 3rd, with the major of the top 15 now food products
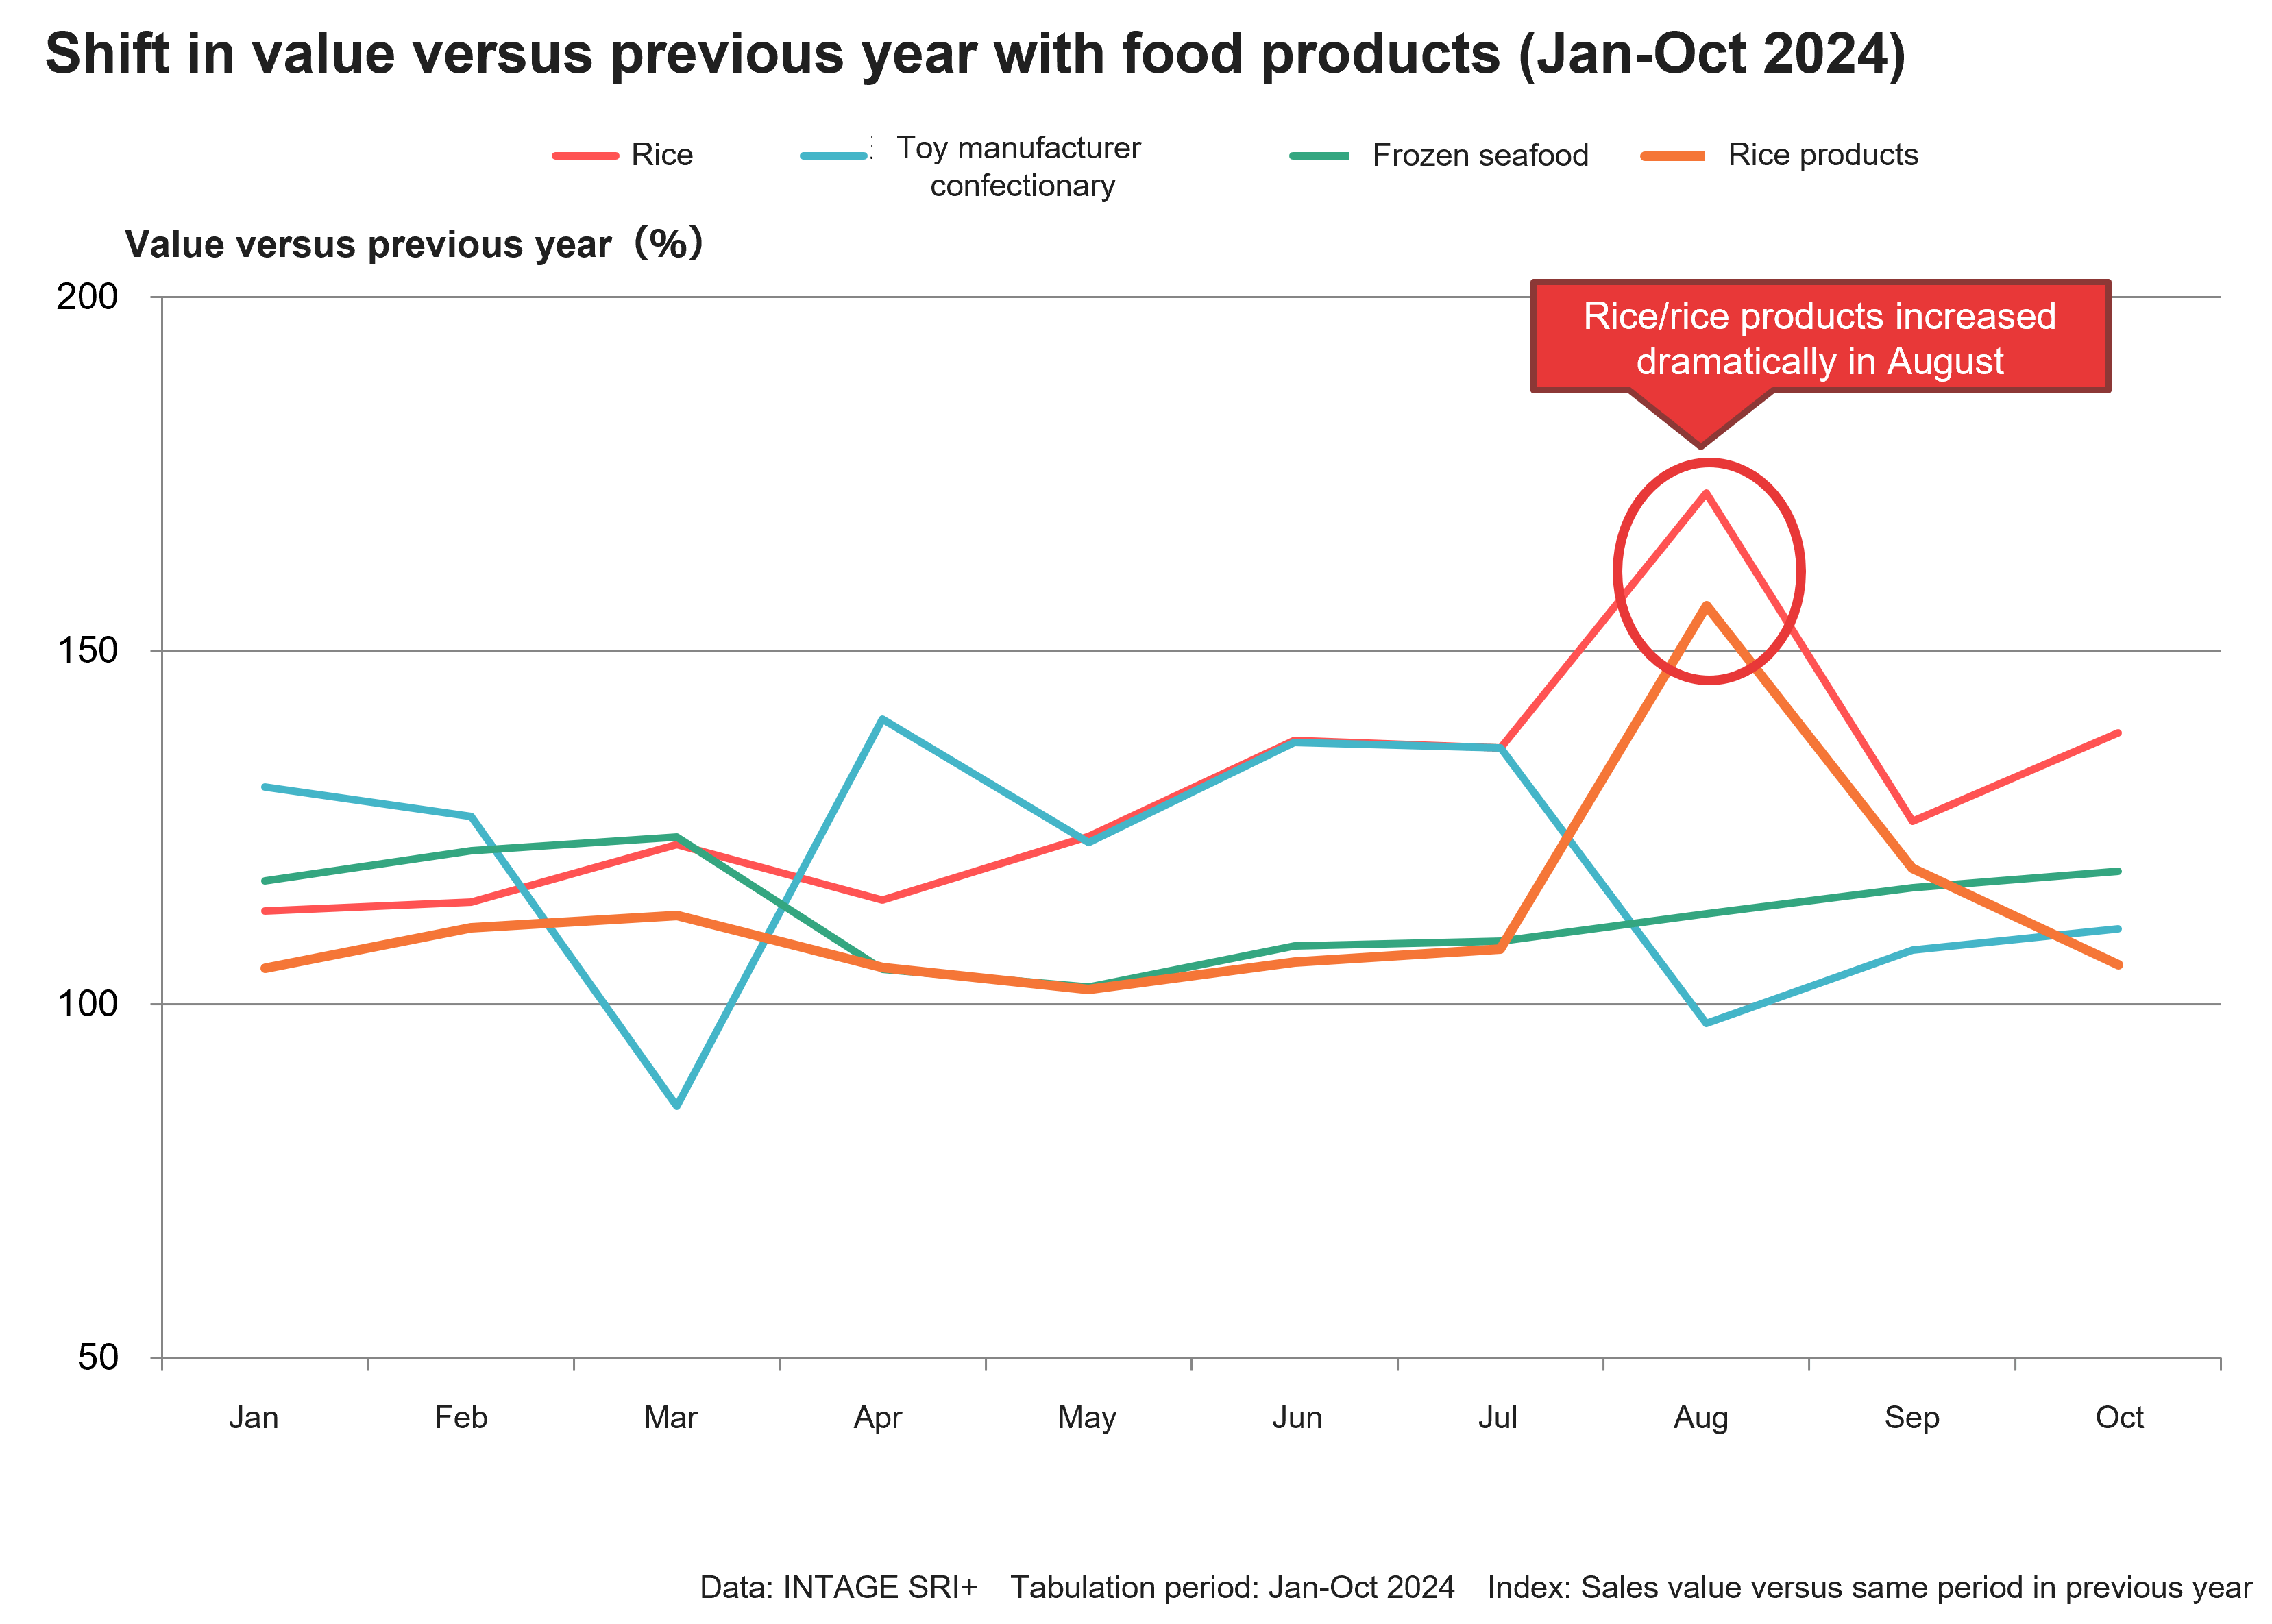
People still have vivid memories of the oppressive heat this year. Another major social topic that emerged in the summertime was the rice shortage. Rice gradually disappeared off supermarket shelves, with some stores even going on to offer packaged rice in its place, and the price of rice in stores shot up rapidly. Rice thus ranked 3rd at 130% versus the previous year, with rice products mainly including packaged rice ranking 10th (113%) and also joining the top-selling products rankings. In August when there were a particularly large number of repeated reports by media outlets on the rice shortage, and just before the new rice for the year was released, rice’s sales value reached its peak along with this commotion, increasing to 172% versus the same month in the previous year (Fig. 2). In addition, on examination of the shift in numbers of rice products in stores, the number of these products dropped to around half that available in the previous year, mainly in the Kinki and Tokyo metropolitan areas, and since the price rise, it has continued to defy expectations of a return to its previous price.
Another characteristic of this year, alongside this historically prominent public outroar about rice, was the ongoing price hikes mainly with food products. Driven at least partly by this, 6 out of the top 15 items this year are food products.
Fig. 2
6th place toy manufacturer confectionary (117%) has been driven by popular TV anime and related products like games. 9th place frozen seafood (113%) has had a notable increase in coverage by private label brands. 12th place candy (113%) has sold well due to strong sales of gummies as well as infection-related throat lozenges. Two beverages also joined the rankings, with tomato juice at 4th place (125%) due to demand as an alternative to tomatoes themselves, due to their soaring prices, and carbonated beverages at 8th place (113%) due to growth with hit products claiming to be sugar-free and moderately sweet. Inbound demand was also strong, with the sale of 5th place cardiotonics (118%), 7th place lip balm (116%) bolstered in part by the support of tourists visiting Japan, increasing their sales value.
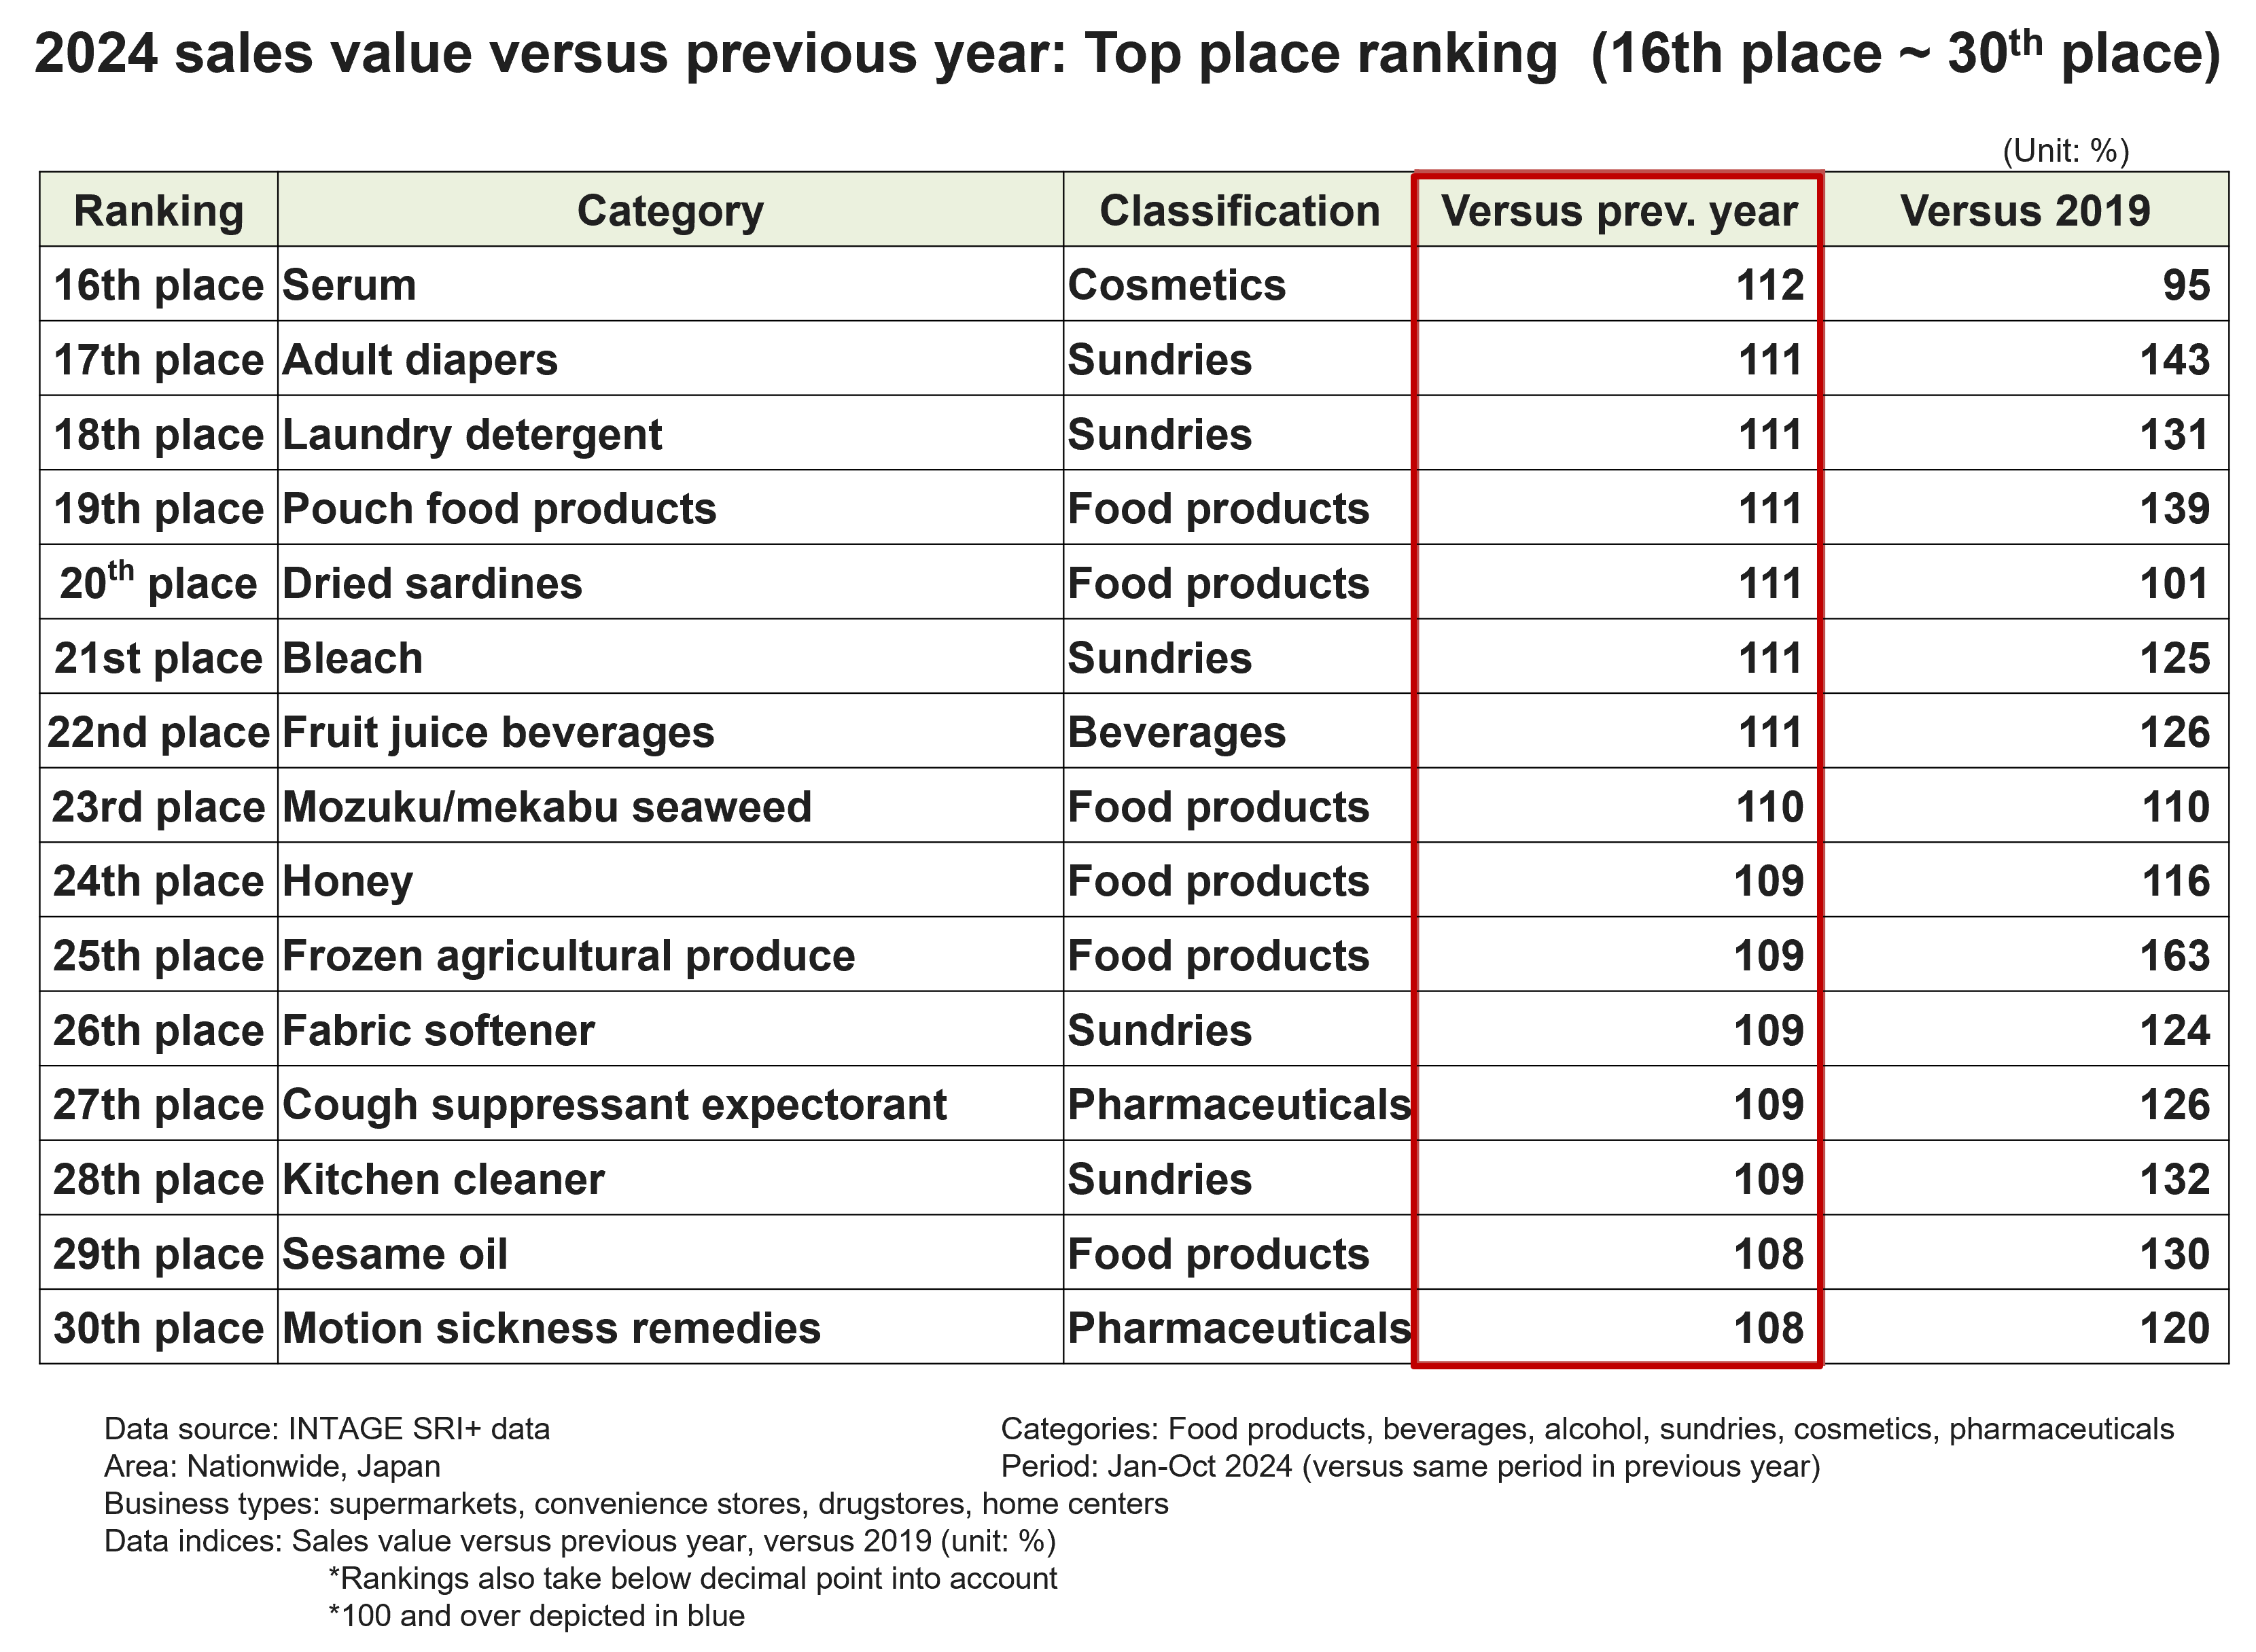
Many food products also ranked 16th to 30th place. Reasons for this unusual trend
Food products also appeared in the rankings prominently below 16th place. 19th place pouched food (111%) performed well due to the switch from canned type items such as tuna. 20th place dried sardines (111%) were strongly influenced by the price hikes, with the oppressive heat appearing to benefit 23rd place mozuku and mekabu seaweed (110%). 25th place frozen agricultural produce (109%) was in demand due to seeming relatively cheap due to fresh vegetable produce being directly impacted by the harsh weather. With daily necessities, detergents including 15th place neutral detergent were also included multiple times in the rankings below 16th place as well, and while strongly impacted by the price hikes, there was also a trend for value-added products such as laundry detergents that are simple to use to gain popularity.
Fig. 3
Looking back on the shifts in best-selling items since 2020
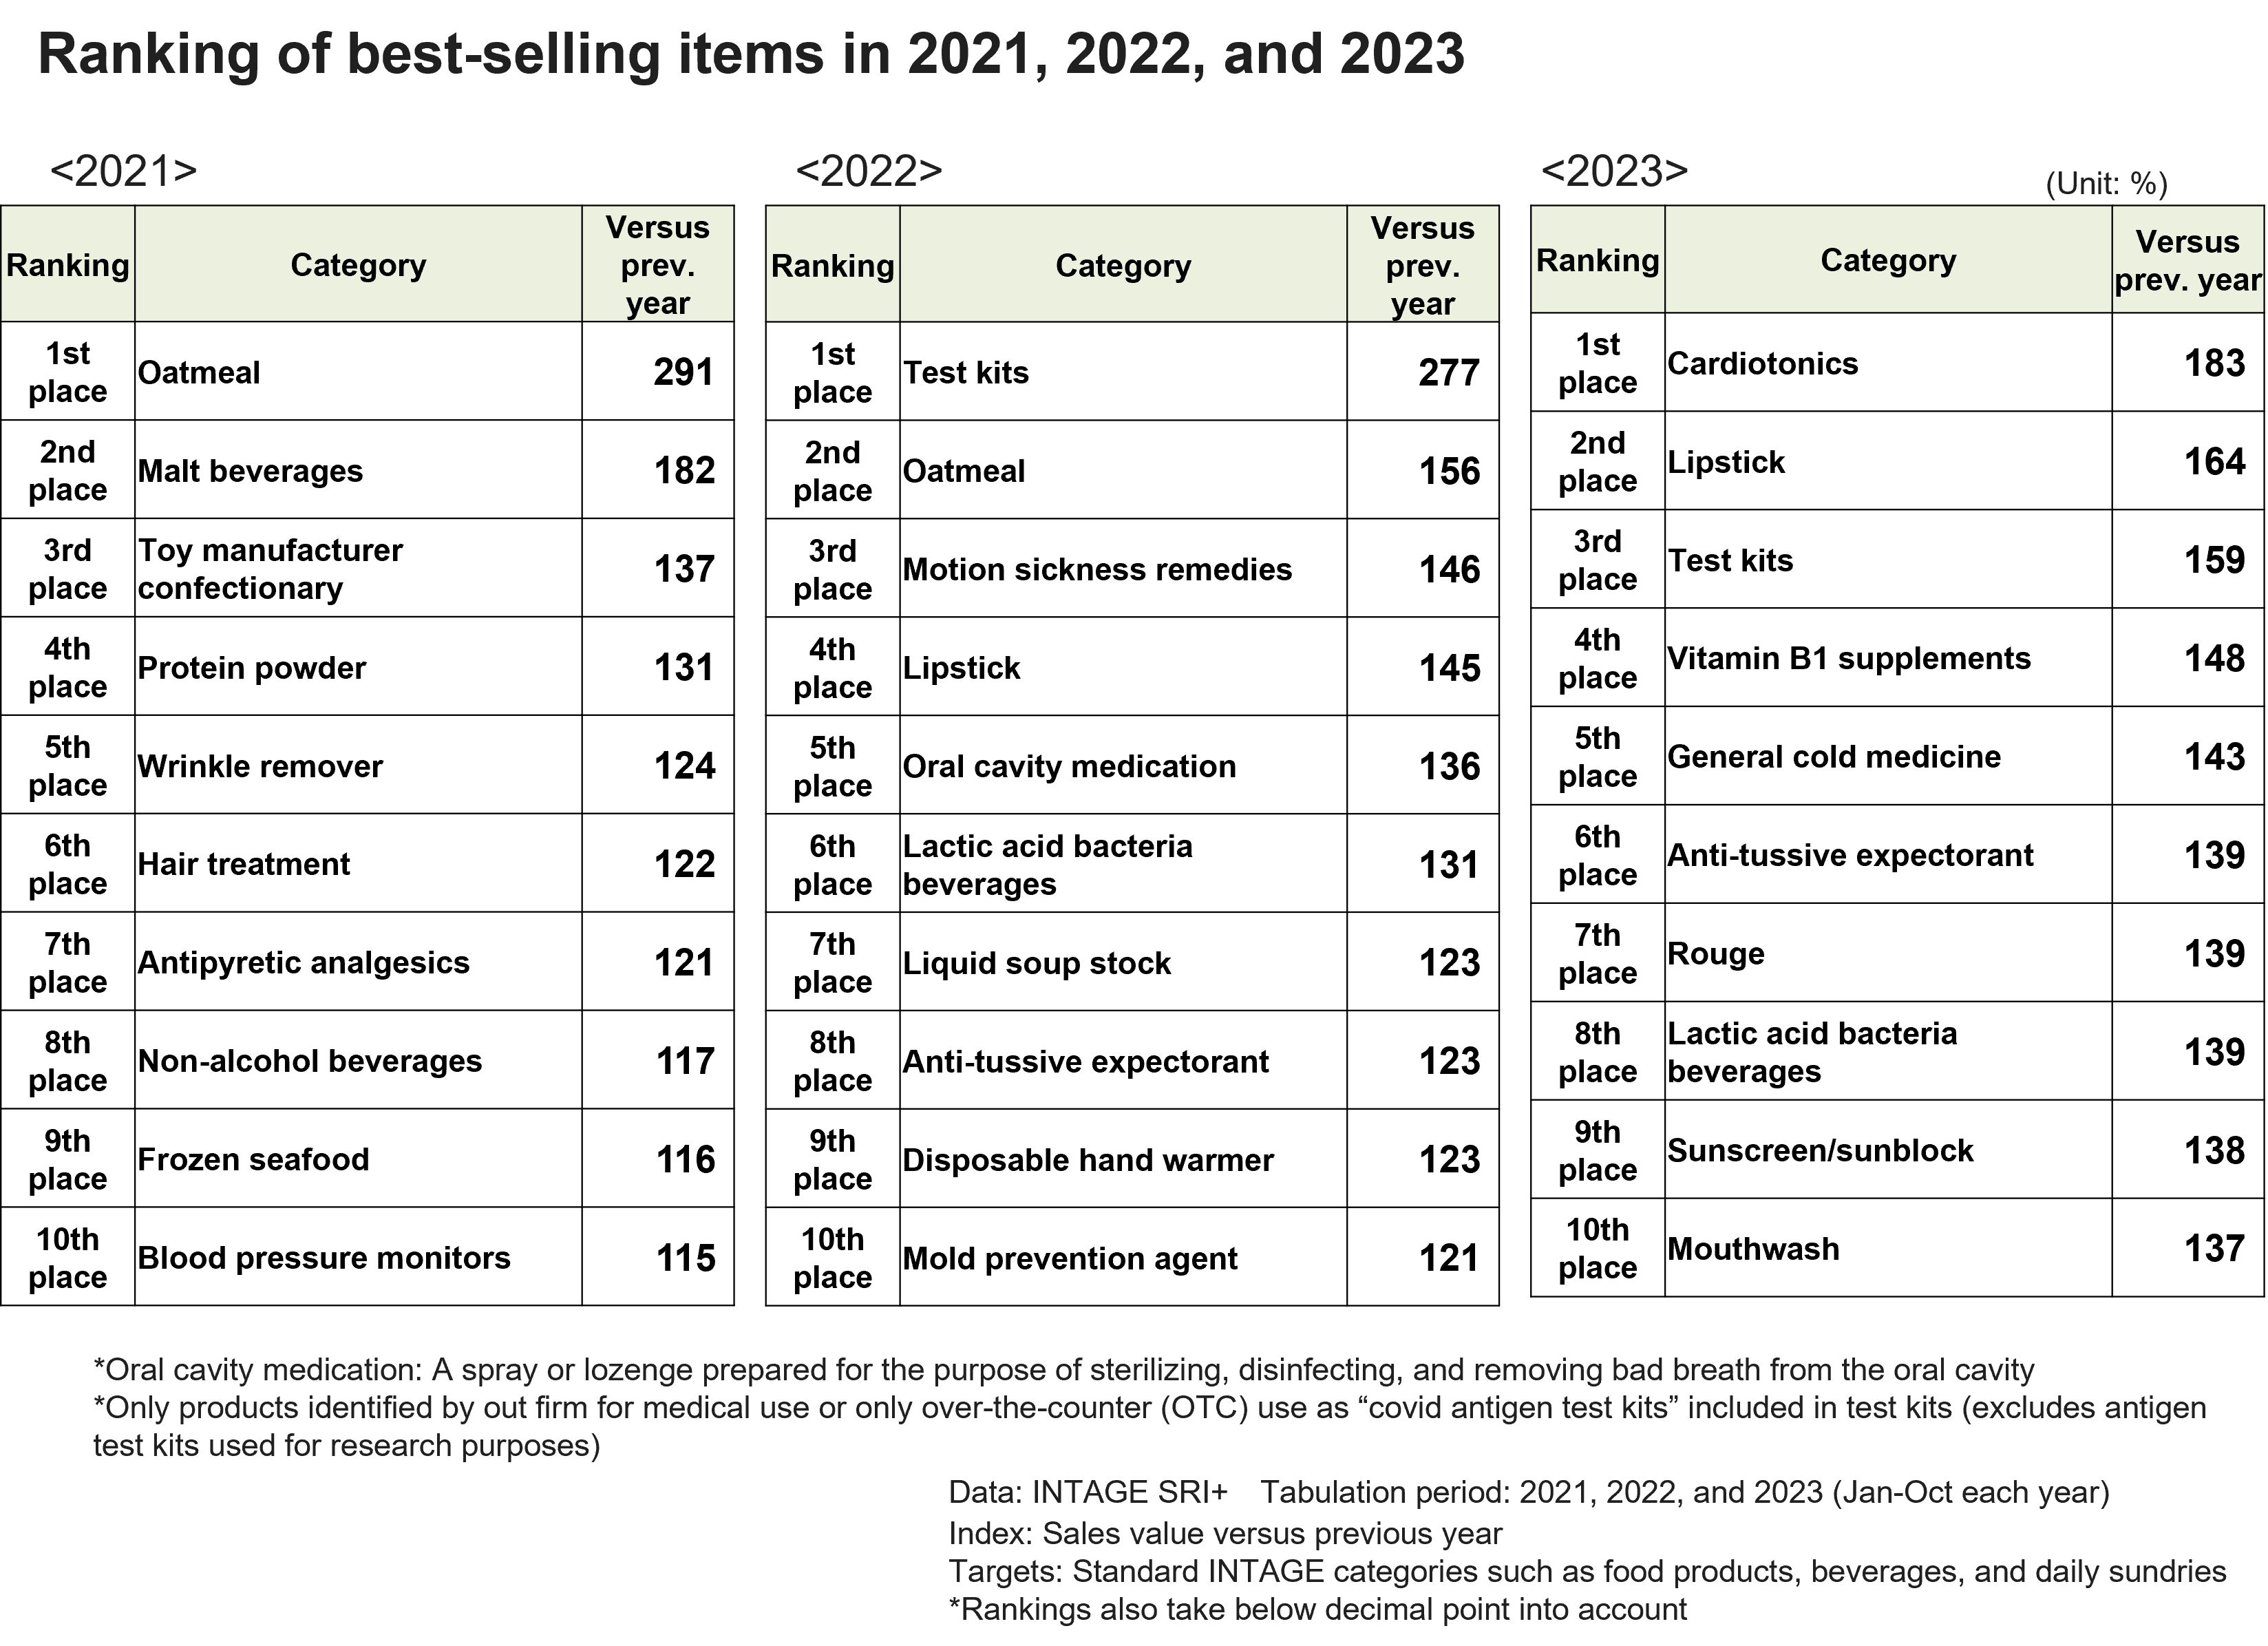
Since the covid crisis, the trends in best-selling items have changed sizably every year. Let’s examine how this has shifted. In 2020, the first year of the covid crisis, hygiene products such as masks saw their sales go through the roof, while in 2021, due in part to demand driven by staying at home, food products with health claims ranked highly, such as oatmeal at 1st place, and malt beverages at 2nd place. In 2022, a variety of products for “co-existing with covid” entered the rankings, from covid countermeasures to motion sickness remedies for use in travel, with test kits at 1st place, oatmeal at 2nd place, and anti-nausea tablets (such as motion sickness drugs) at 3rd place. Furthermore, last year saw the revival of demand from inbound tourists, driving items like 1st place cardiotonics and 2nd place lipstick due to the relaxation of the need to wear masks to top place rankings.
Fig. 4
The ranking of products struggling with sales – items that sold well during the covid crisis have taken a dive
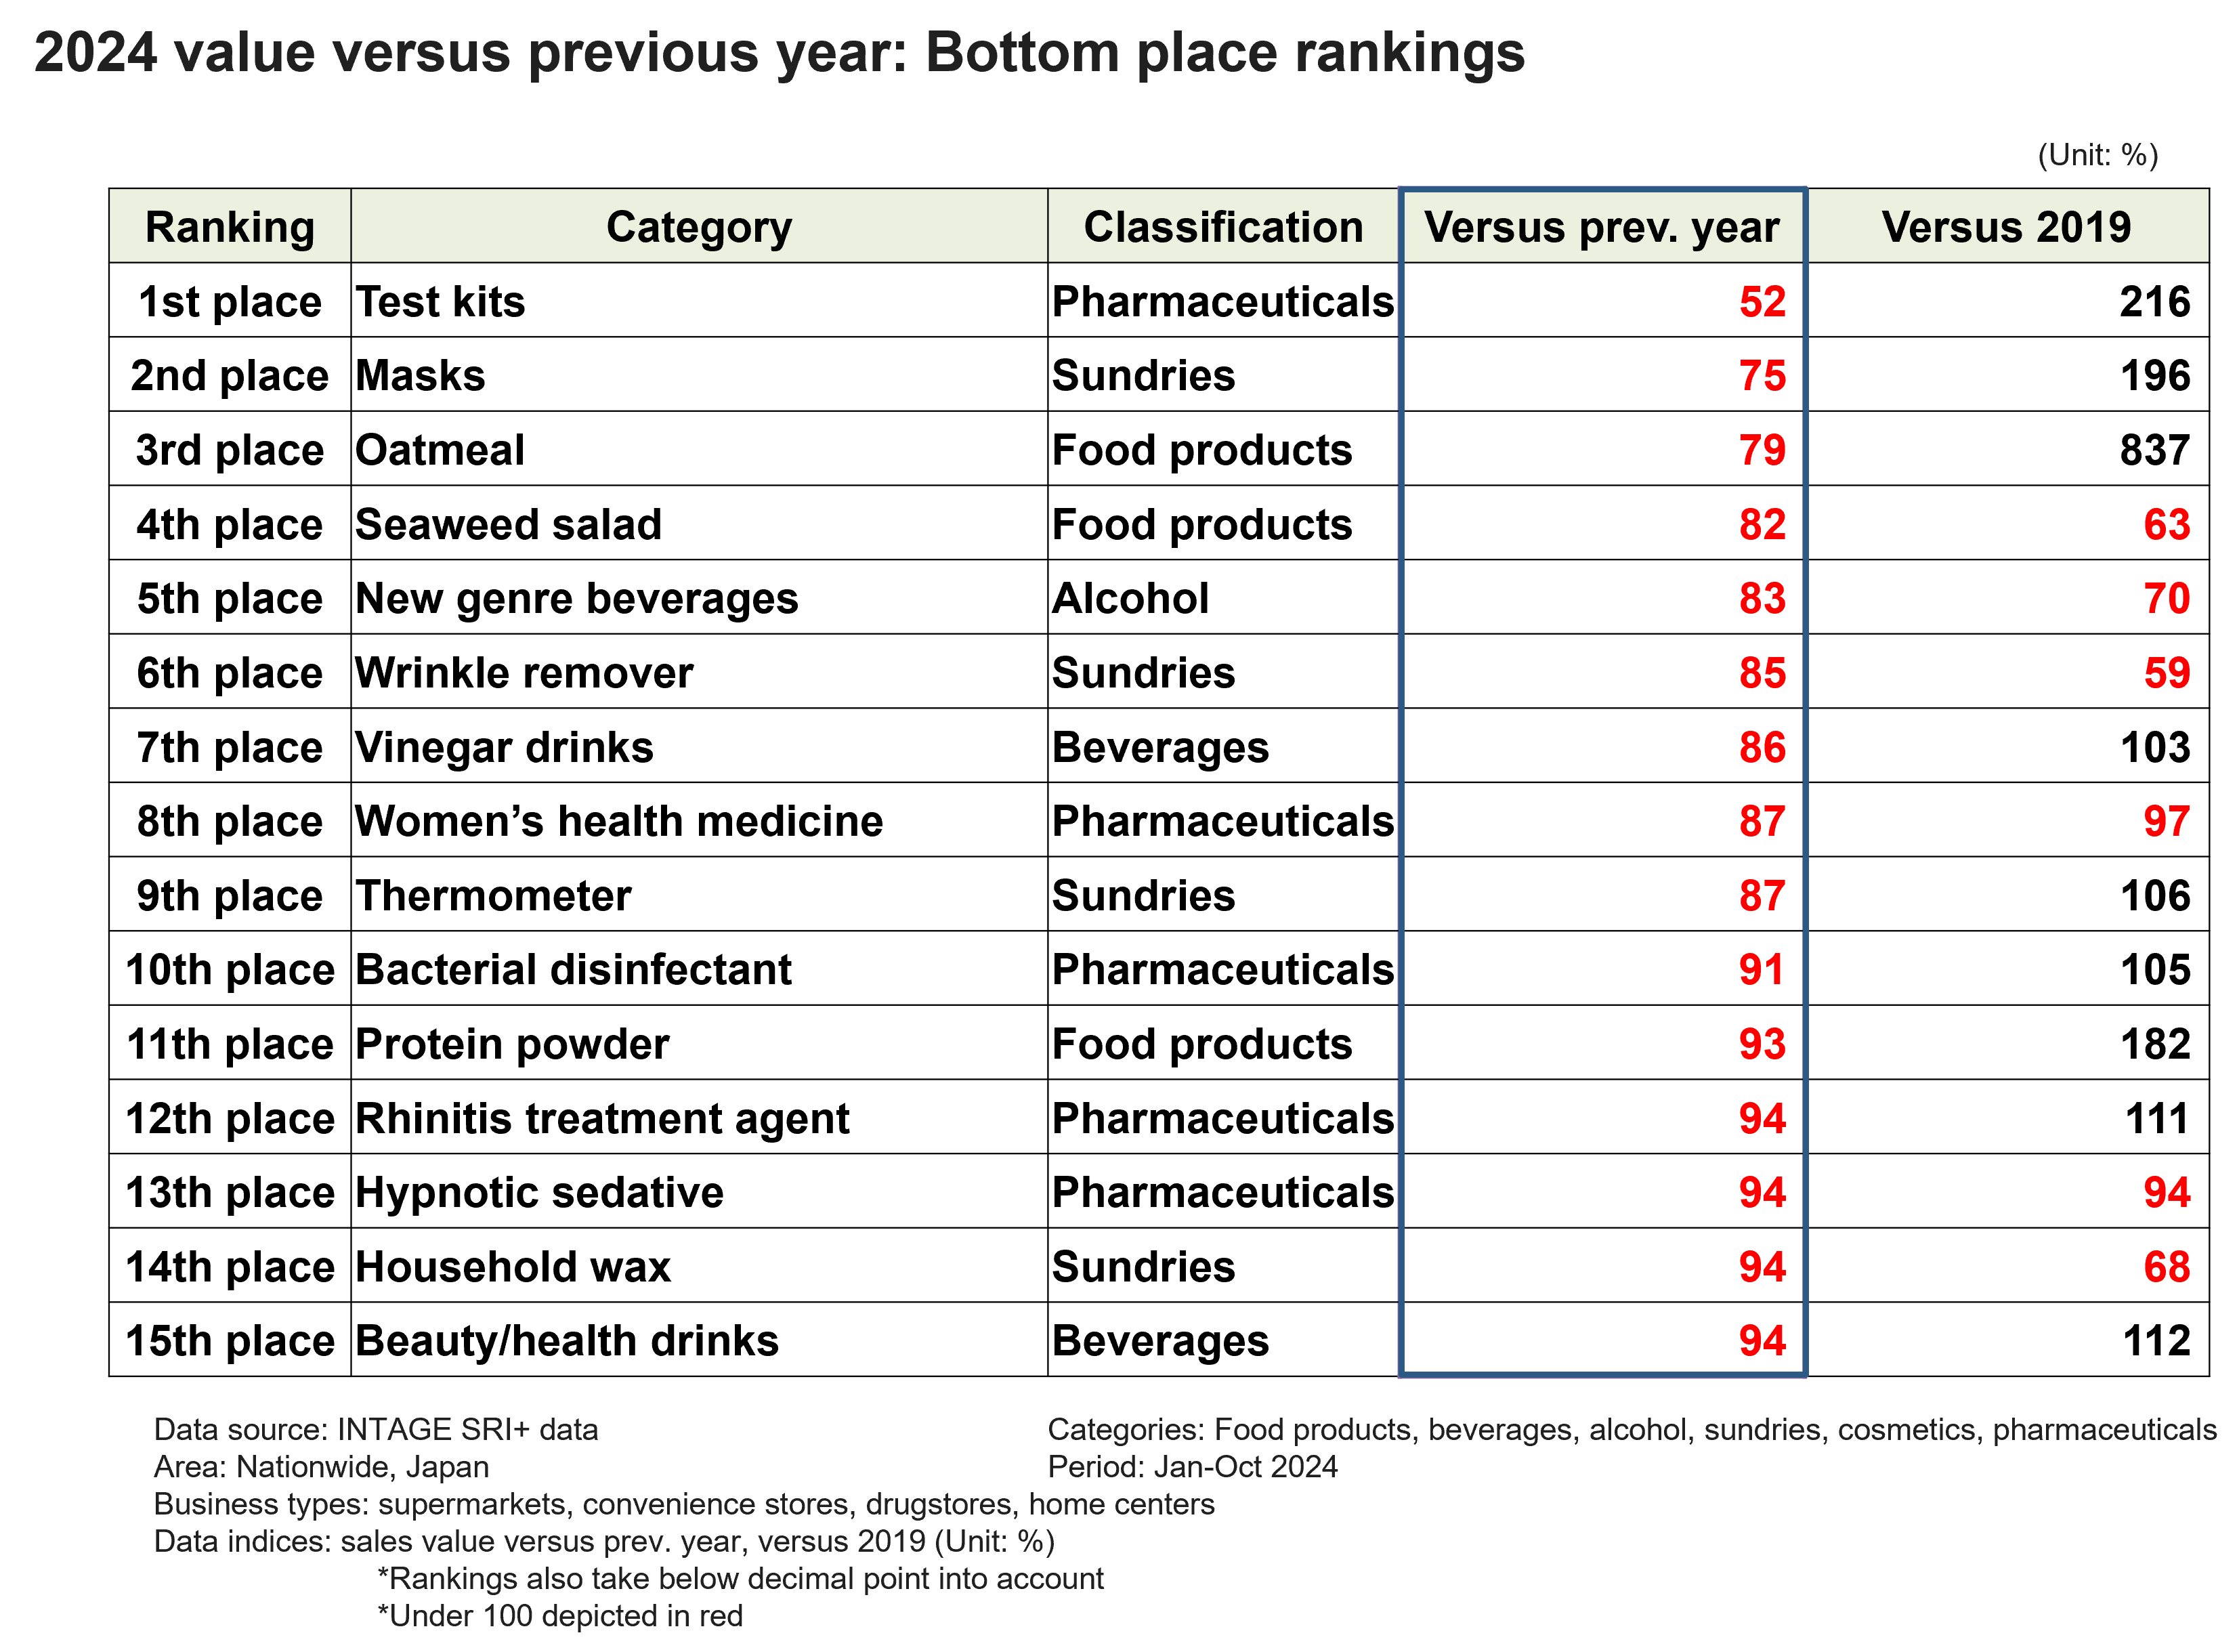
Finally, let’s also take a look at the rankings of items that are struggling with sales this year (Fig. 5). Items that experienced sizable increases in sales value during the covid crisis rank at top place, such as 1st place test kits (52%), 2nd place masks (75%), and 3rd place oatmeal (79%). 11th place protein powder (93%) etc. are also in a similar situation, but have sizably exceeded their sales values versus pre-covid 2019. Other products have seen an ongoing decrease in sales value due to changes in lifestyle etc.
Fig. 5
In addition to domestic factors here in Japan such as record-breaking oppressive heat and price hikes that are likely to continue next year, phenomenon that have a sizable impact on people’s lives and behavior, such as changes in international affairs, are expected to continue to occur in future as well. INTAGE thus plans to continue releasing these “best-selling item rankings” in future as well to widely inform a large number of people about influences on consumer purchases.
“Best-selling items ranking for the first half of 2023” symbolizing the post-covid era (04/07/2023)
“Best-selling items ranking for 2022” symbolizing the covid crisis (20/12/2022)
“Best-selling items ranking for the first half of 2022” impacted by changes in behavior (05/07/2022)
Ranking of items that struggled with sales in 2021, the second year of the covid crisis (16/12/2021)
Best-selling items ranking for 2021 – What trends are present in the consumer goods market in the second year of the covid crisis? (09/12/2021)
Ranking of items that struggled with sales in the first half of 2021, the second year of the covid crisis (12/07/2021)
What items are continuing to sell well amidst the covid crisis? Best-selling items ranking for the first half of 2021 (30/06/2021)
“Ranking of items that struggled with sales this year: 2020” impacted by covid (15/12/2020)
Best-selling items ranking for this year: 2020” Dramatic changes brought about by covid (07/12/2020)
What sold well this year? Ranking of strong-selling categories in 2019 (25/12/2019)
Hot off the press! Ranking of strong-selling categories in 2018: What sold well this year!? (12/12/2018)
Hot off the press! Ranking of strong-selling categories in 2017: What sold well this year!? (07/12/2017)
Hot off the press! Ranking of strong-selling categories in 2016: What was in the lineup this year?! (13/03/2017)
[SRI+® (nationwide retail store panel survey)] Retail sales data continuously gathering daily sales information from approximately 6000 stores nationwide in Japan including supermarkets, convenience stores, home centers, discount stores, drugstores, and specialty stores, boasting the No. 1 sample design numbers and chain coverage of retail panels domestically*1. *SRI+ is statistically processed, with no information disclosed whatsoever that may identify the survey monitor stores. *1 Some business channels
Reproduction and Quotation
◆This report is copyrighted by INTAGE Inc. Please check the following prohibitions and precautions, and specify the source when reproducing or quoting this report. “Source: INTAGE “Knowledge Gallery” article published MM/DD/YYYY article”
◆The following are prohibited: ・Alteration of this article in full or in part ・Sale or publication of this article in full or in part ・Uses that are against public order and morality, and uses connected with illegal activities ・Reproducing or quoting panel data* for the purpose of advertising or promoting companies, products, or services *Panel data include: SRI+, SCI, SLI, Kitchen Diary, Car-kit, MAT-kit, Media Gauge, i-SSP, etc.
◆Other precautions: ・INTAGE Inc. shall not be liable for any trouble, loss, or damage caused by the use of this report ・These usage rules do not restrict the use of quotations or other uses permitted under the Copyright Act of Japan
◆For inquiries about reproduction and quotation, click here