Understanding “Power Families”: A High-Income Segment Driving Market Trends
You may have come across the term “power family” — referring to households with children and an annual income of 15 million yen or more. These families are gaining attention as a high-purchasing-power segment that continues to drive the market despite rising prices and the depreciation of the yen.* The increase in power families is due to the inroads women are making in society, such as the increase in women who do not resign after getting married, and continue to work at the firm they have been employed by to date as permanent fulltime employees. According to materials by the National Institute of Population and Social Security Research(*1), the proportion of women who continued their jobs to date after getting married was 56.9% in 1990 ~ 1994, and rose to 72.7% in 2010 ~ 2014. In addition, according to Cabinet Office materials(*2), 66.5% of women in their 20s are fulltime workers, as are 49.3% of women in their 30s.
This article will get to the bottom of who power families are via survey findings, and explore hints for product/service development targeted at them.
In this article, we conducted a survey defining power families as “households in which both spouses work (fulltime), children are present, and the household income is 15 million yen or more (before tax)”. For comparison, we defined the average child-rearing segment (hereafter referred to as the general segment)(*3) as “married households with children where the annual household income is 6 million to 9 million yen regardless of the couple’s working style, whether they work fulltime, part-time, or are unemployed”. The survey’s target was men/women aged 20 ~ 59 for both segments.
1. Who power families are
First, let’s examine how power families (the power segment) and the general segment differ in terms of demographics such as age, residence/area, and number of children.
The average age of the power segment is 47.8 years old, while the general segment is 46.5, which is almost the same. On average number of children as well, the power segment has 1.87 and the general segment 1.90, virtually on par.
In terms of type of residence, 87.2% of the power segment own their own home versus 77.1% of the general segment, with the power segment 10.1 points higher on home ownership rate. In addition, 24.1% of the power segment live in newly built apartment buildings (such as condominiums), some 15.5 points higher than the general segment.
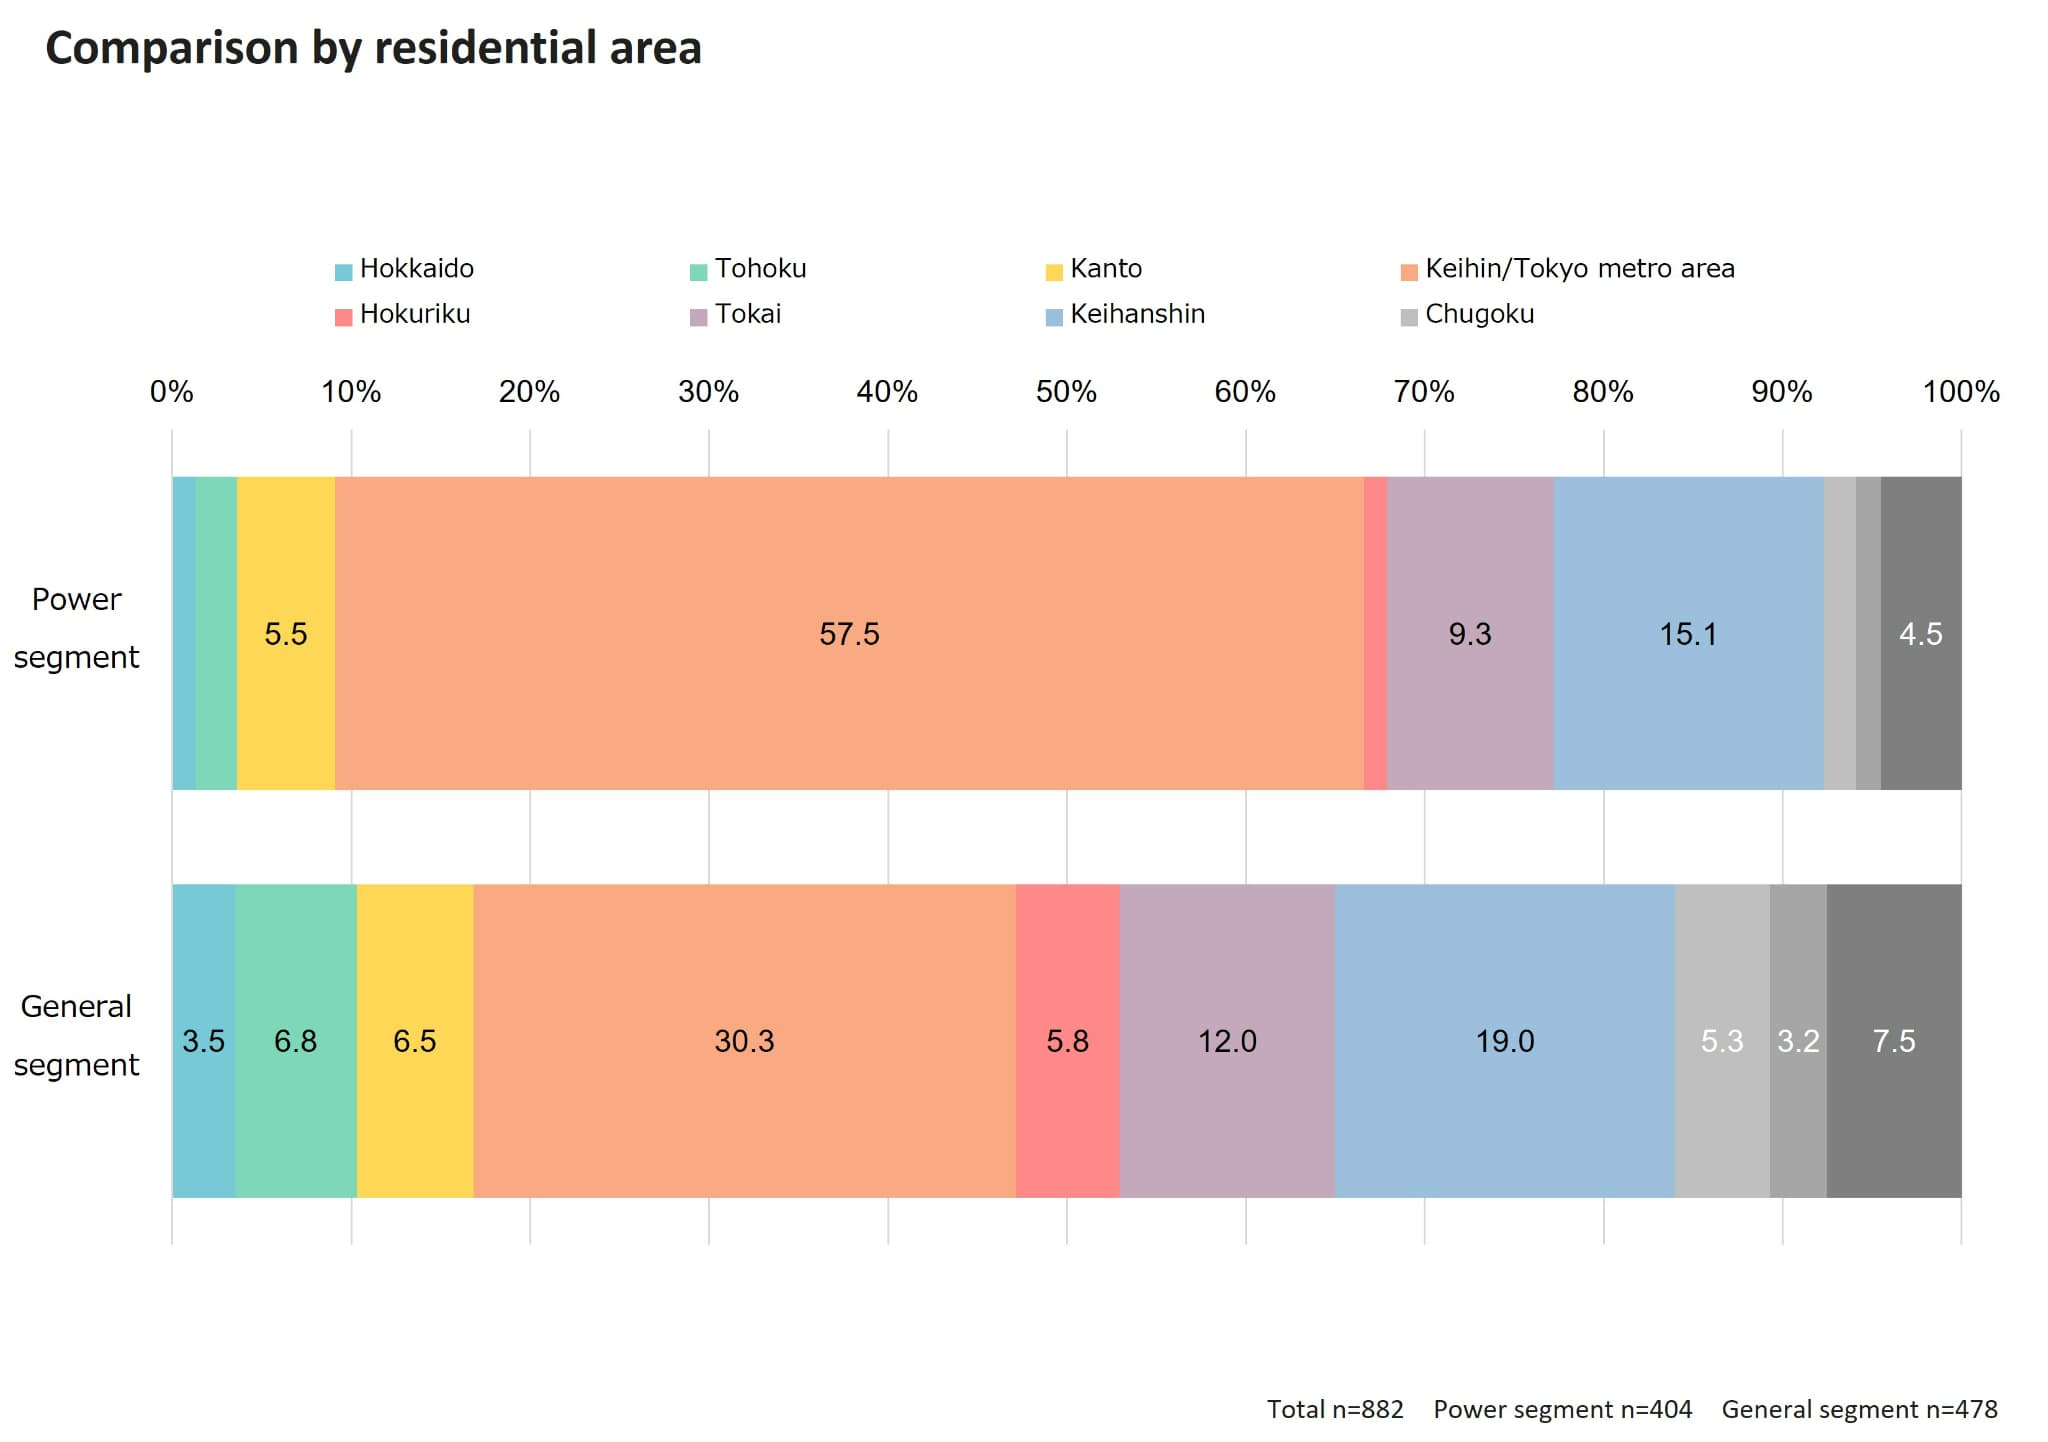
One factor the power and general segments differed on particularly sizably was residential area. (Fig 1) It is apparent 57.5% of the power segment are concentrated in Tokyo, Kanagawa, Saitama and Chiba prefectures. This may be due to the corporate environment and high-income work enabling married couples to both work fulltime is concentrated in Tokyo and its three surrounding prefectures, and why as previously mentioned, many of the power segment lives in apartment complexes (such as condominiums).
Fig 1
2. How power families work and share the housework
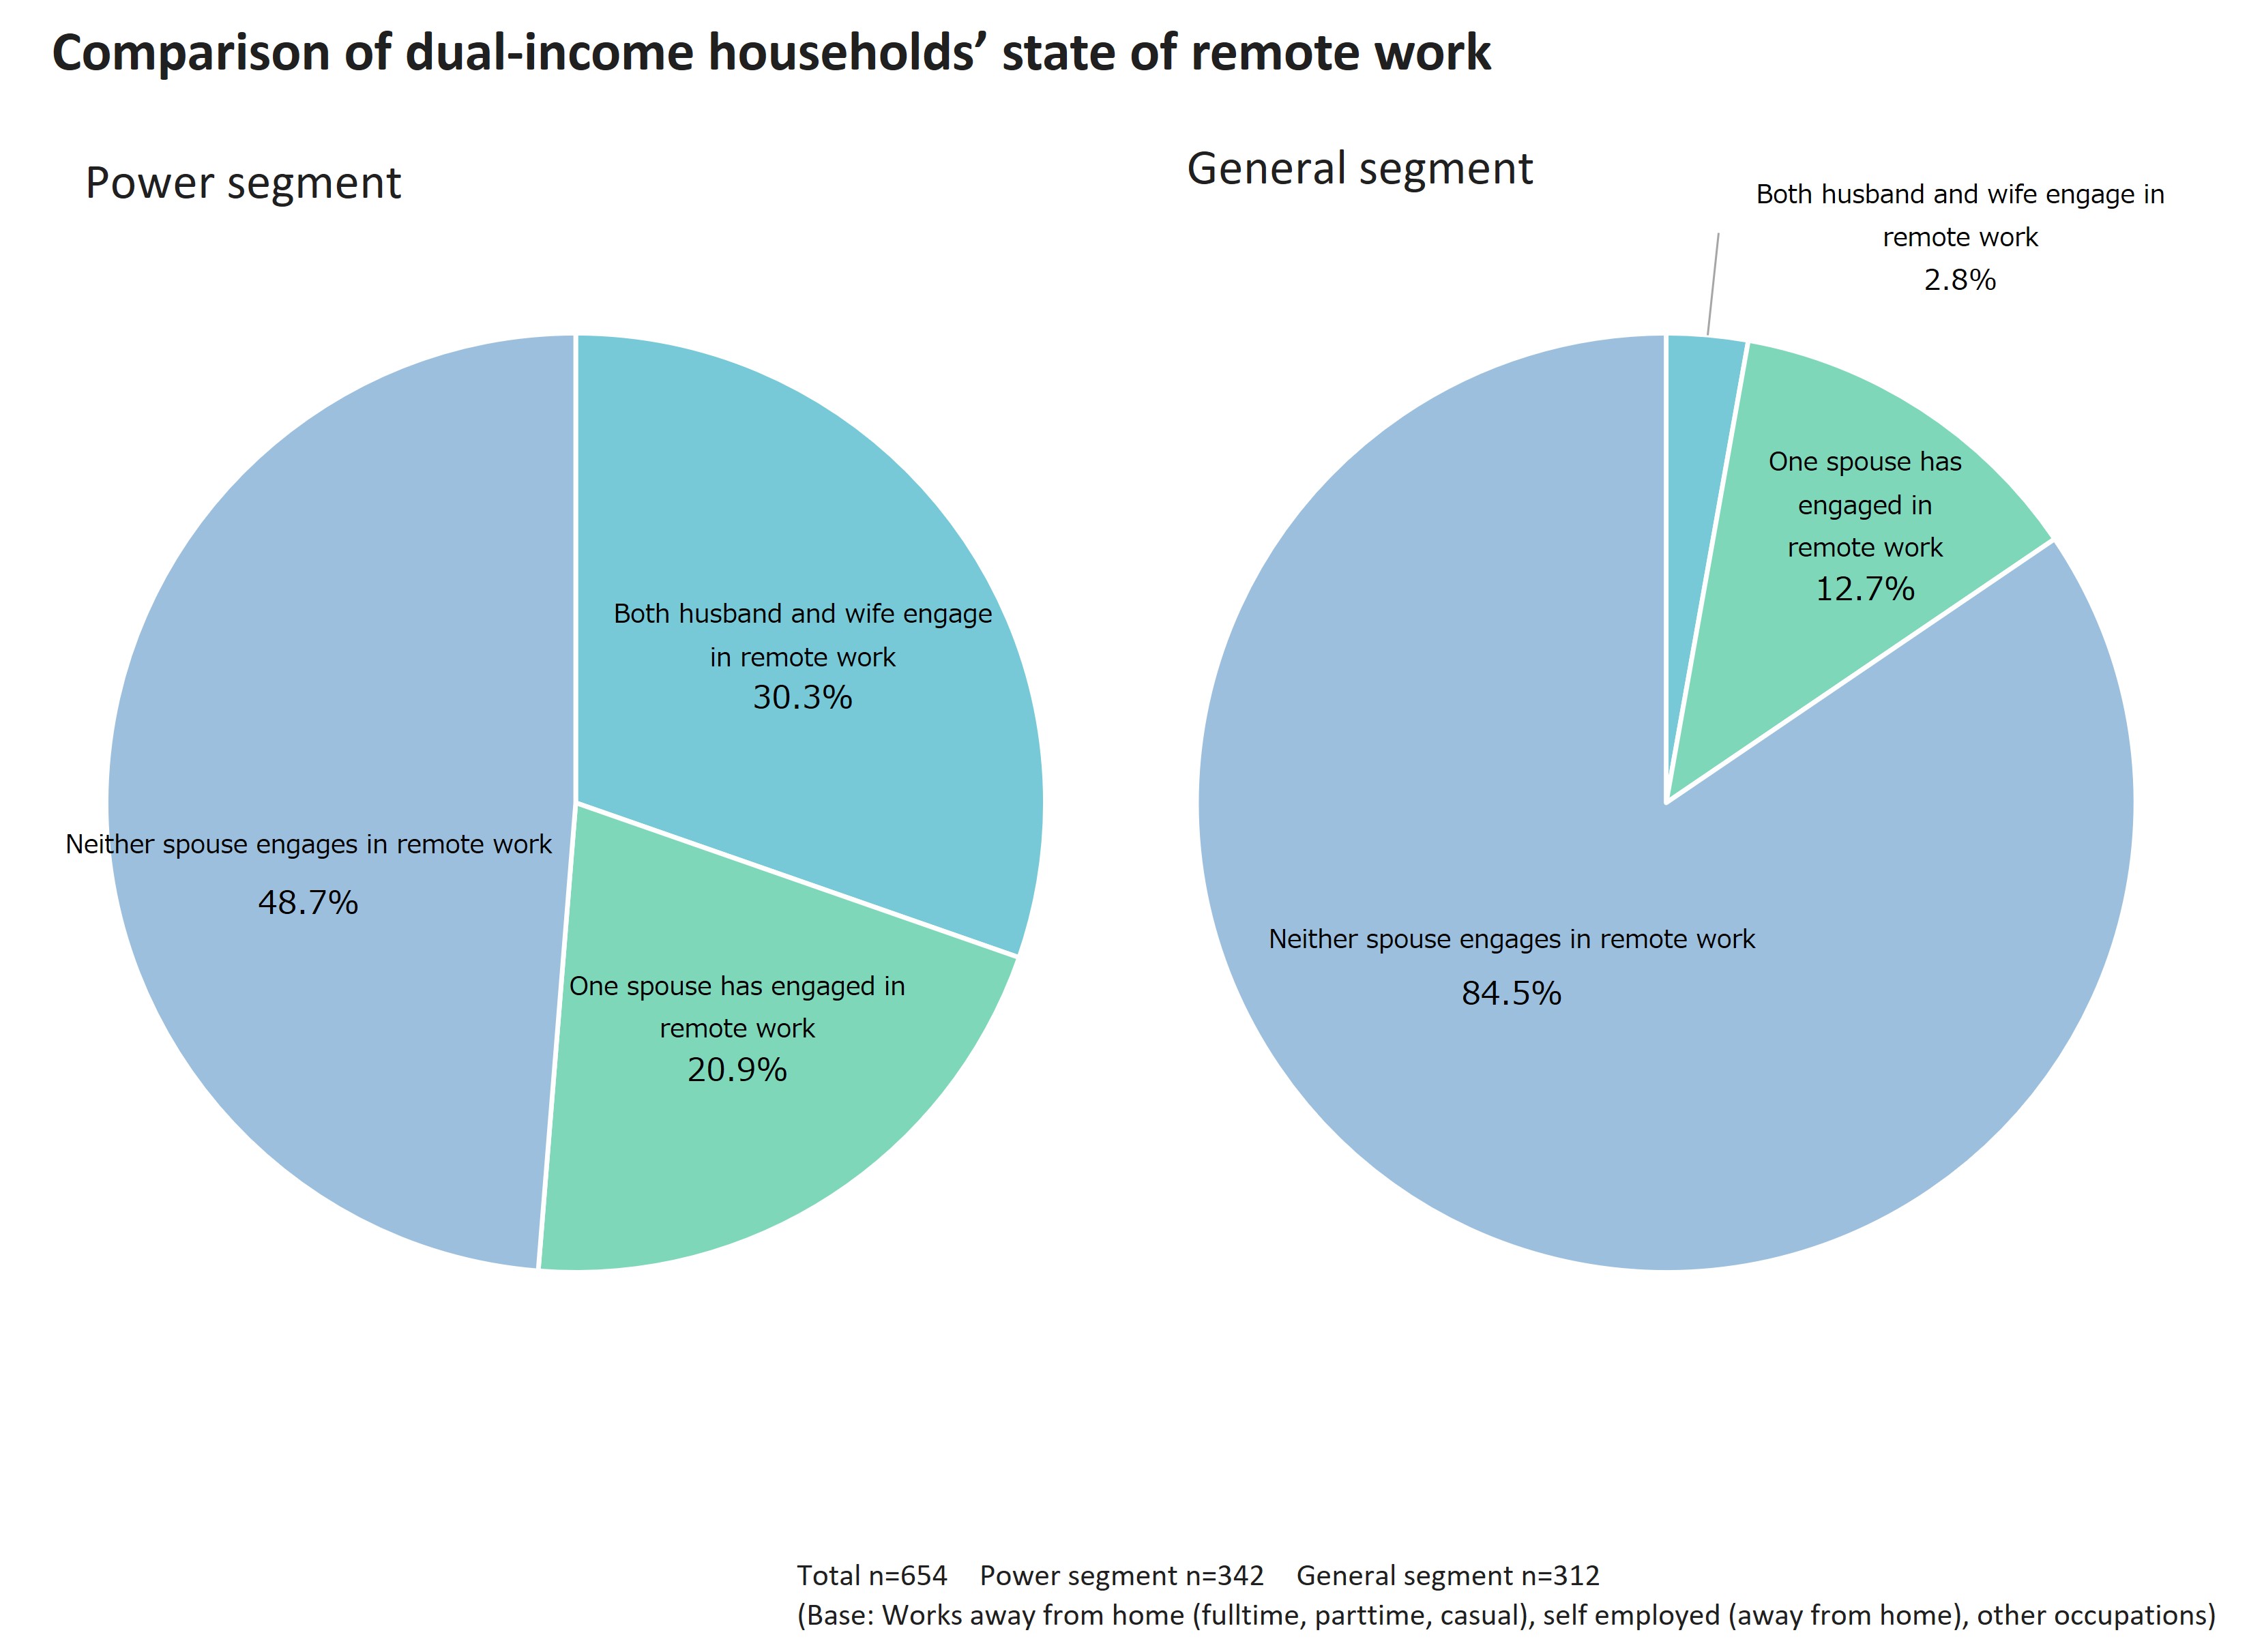
We next compared their working styles. On examination of remote work, which sizably impacts working environment including location and time, 51.2% of the power segment had one spouse working remote, and 30.3% had both spouses working remote. (with both at least once a month) Conversely, 15.5% of the general segment had one spouse working remote (once a month or more), and 2.8% had both spouses working remote. There was thus a sizable difference between the power and general segments in terms of working styles. (Fig 2) Since the power segment spends more time at home, they are also deemed to innovate to make their homes more user friendly, so they can spend time (work) comfortably at home.
Fig 2
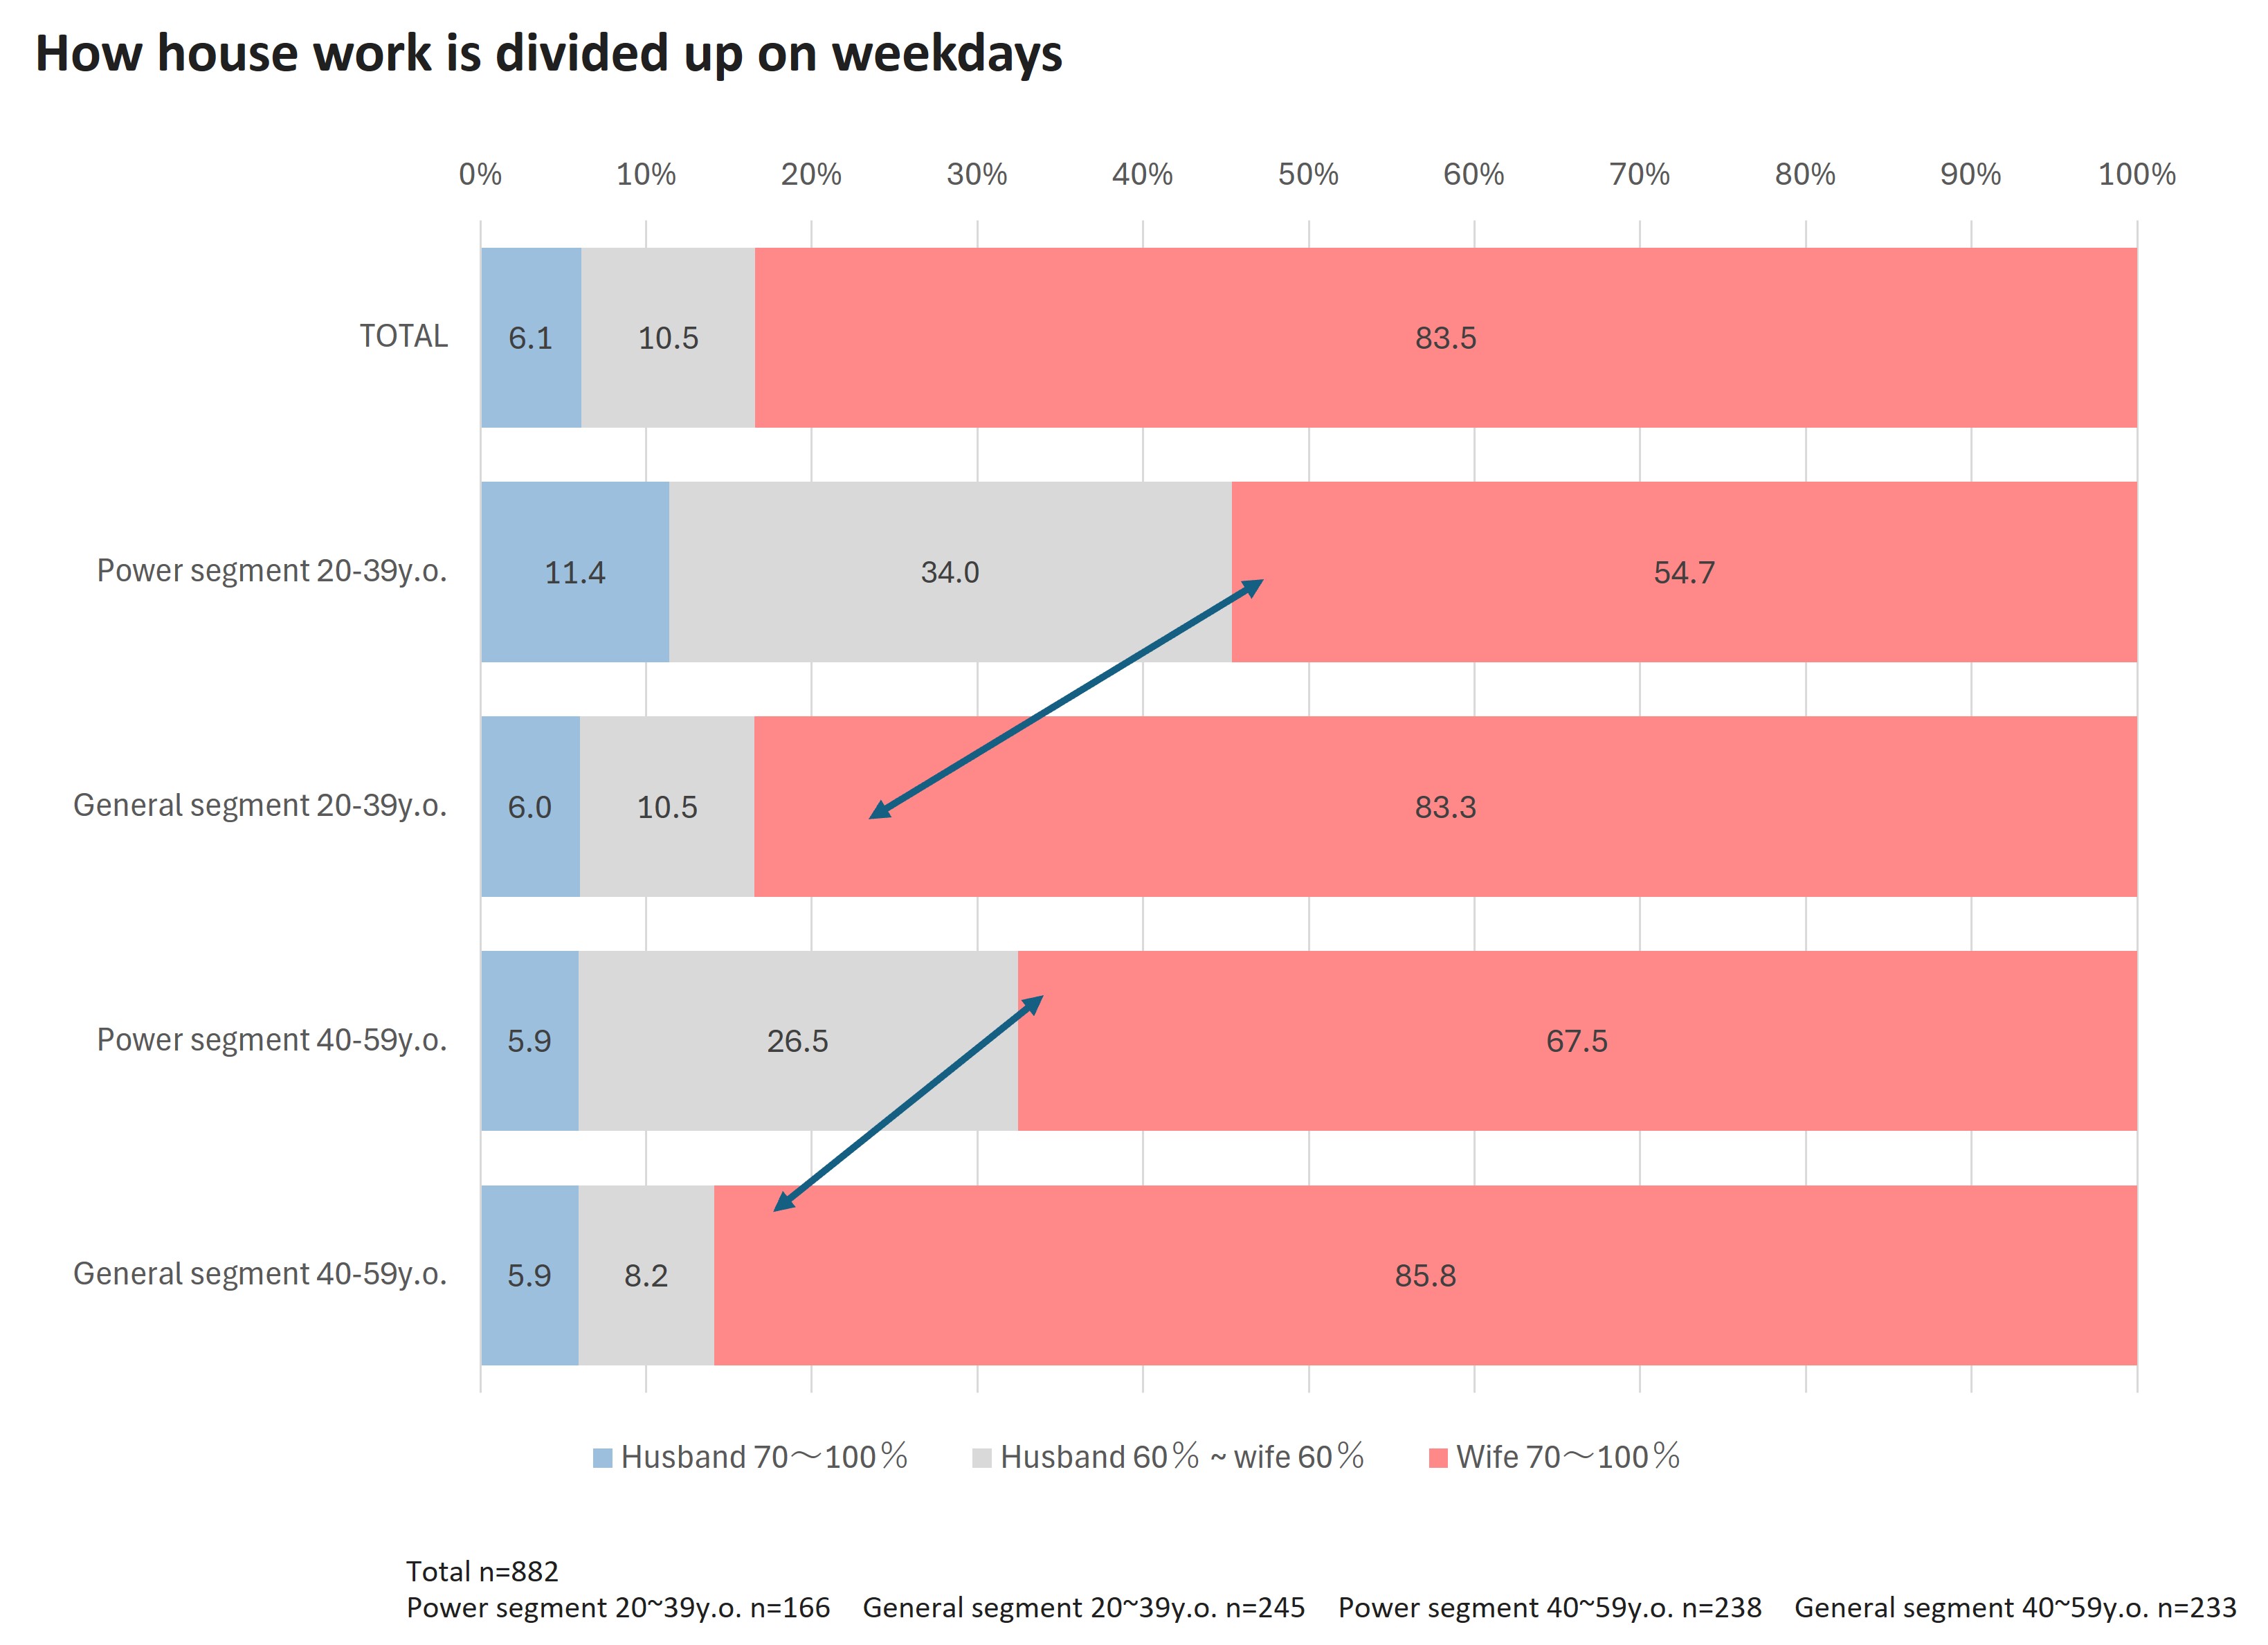
So how do the power and general segments, who have different working styles, divide up housework? We compared the state of how housework is divided up on week days (Fig 3). On observation by age group, among younger 20 ~ 39-year-olds, the wife does 70% or more of the housework on weekdays among 54.7% of the power segment, and 83.3% of the general segment, a difference of 28.6 points. Among 40~59-year-olds as well, a difference of 18.3 points was observed, indicating that power segment couples cooperate with each other in doing the housework.
Fig 3
On observation of this on weekends, among 20~39-year-olds, the wife does 70% or more of the housework on weekends among only 34.0% of the power segment, broadening to a difference of 31.4 points. It is thus clear that power segment couples cooperate more on weekends, Since a high proportion of especially young husbands in the power segment participate in housework, one idea may be to commercialize home appliances and services with men in mind than that are also easy for husbands (men) to use, such as kitchens at a height easy for both spouses to use.
3. How power families use their time and money
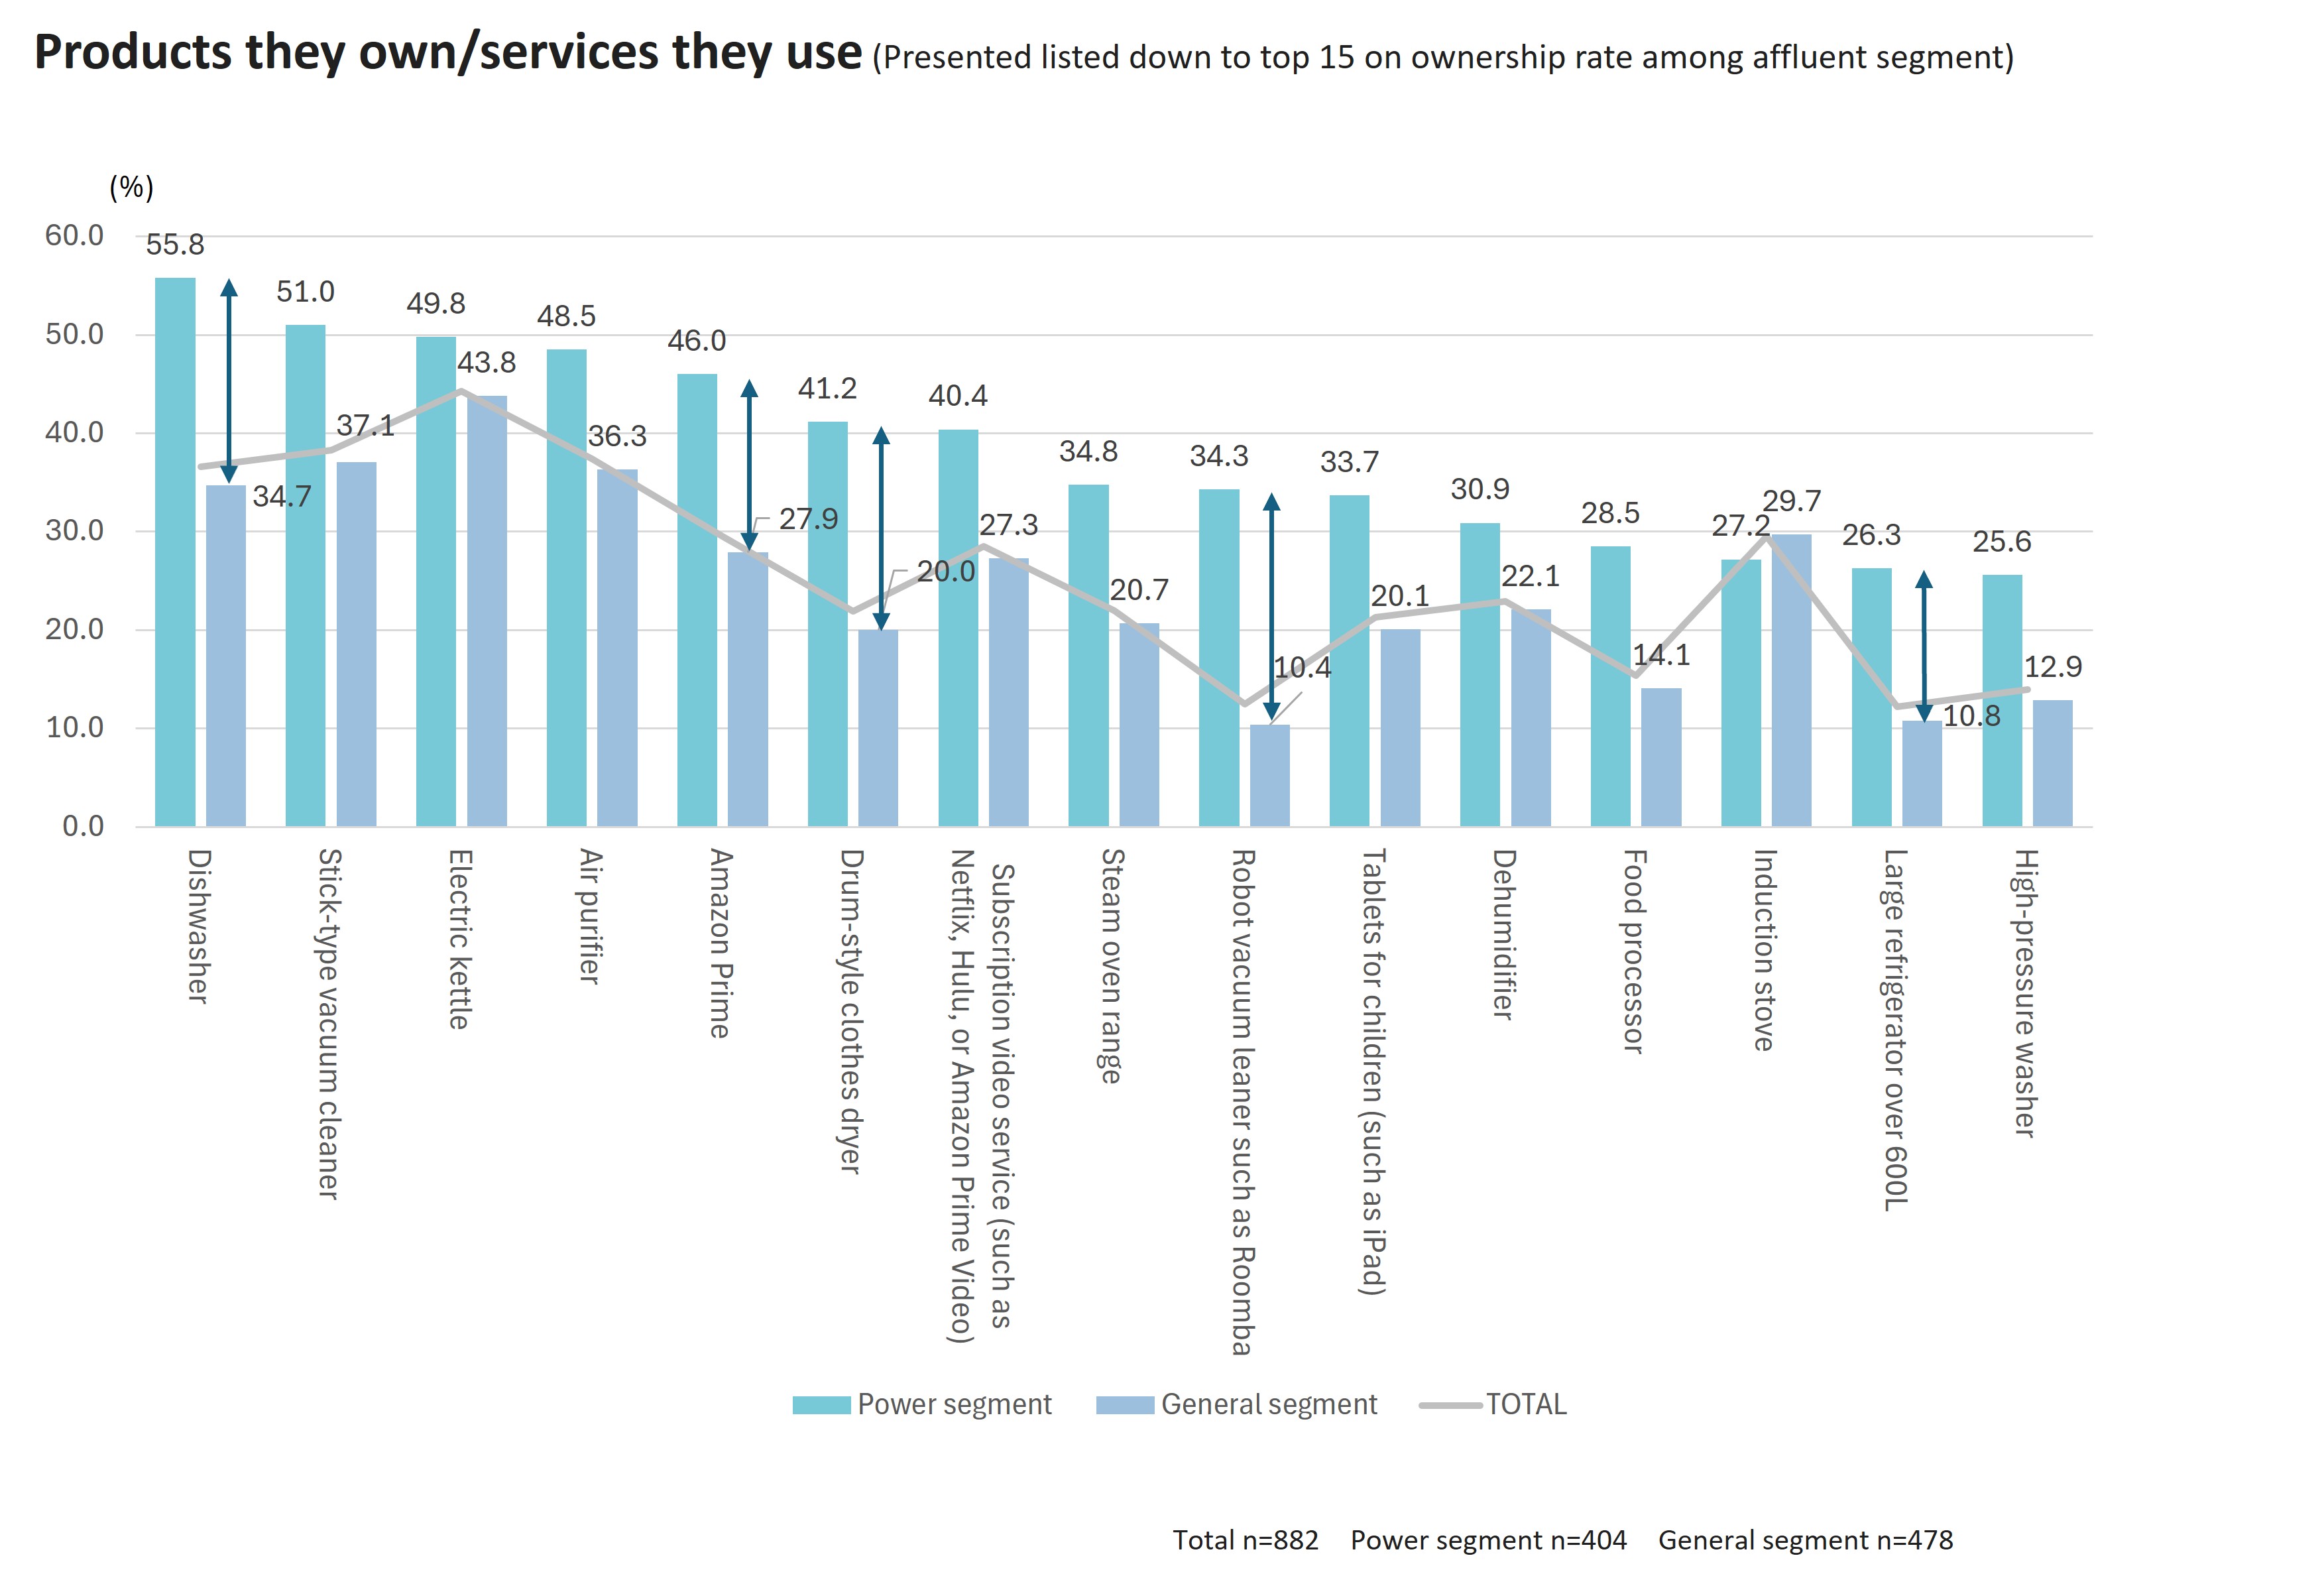
In the previous section, we examined how power segment couples cooperate with housework. Let’s next take a look at the sorts of products they own, the services they use in life, and what they are spending money on. The most notable differences in ownership rates between the power and general segments were on “robot vacuum cleaners (a 23.9-point difference)”, “drum-type clothes driers (21.2-point difference)”, and “dishwashers and driers (21.1-point difference)”. (Fig 4) It is apparent power segment couples who both work fulltime and are raising children often own products that enable them to make housework more efficient (leading to better time performance).
Fig 4
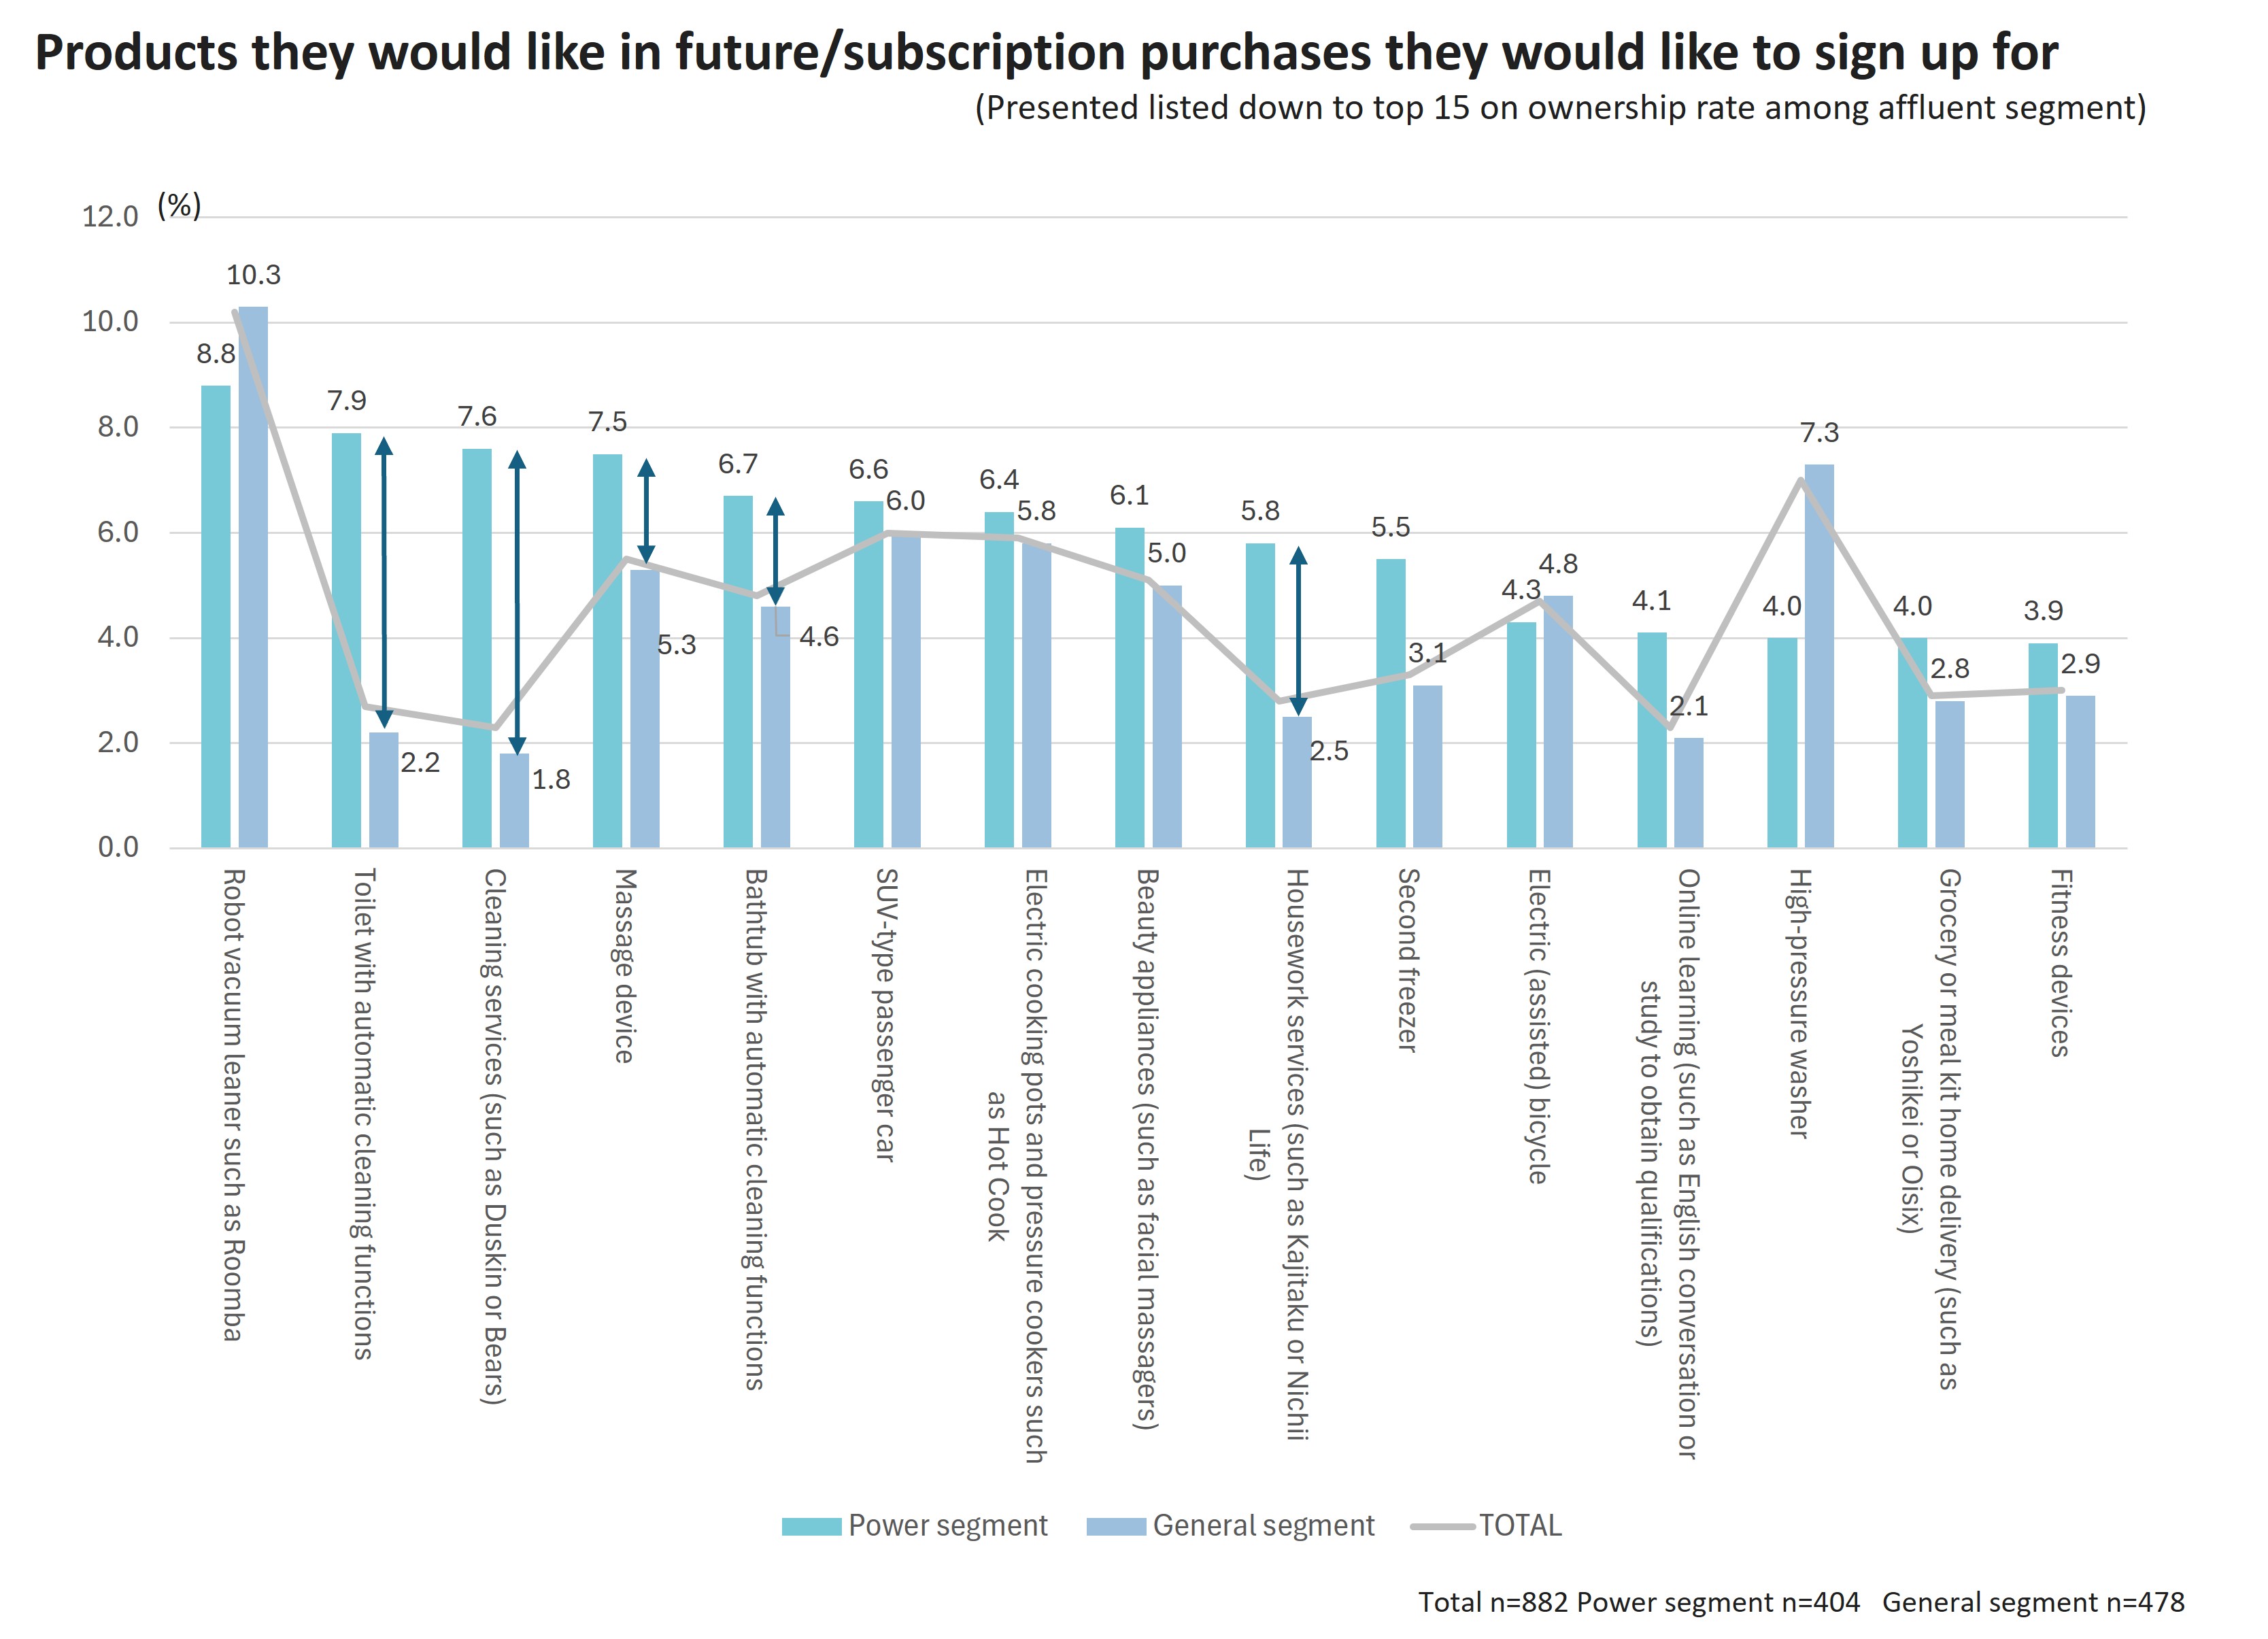
Furthermore upon asking the power segment about the products/services they would like in future, they chose labor-saving/automated products like “robot vacuum cleaners” (8.8%), “toilet with automatic cleaning functions” (7.9%)、”bathtubs with automatic cleaning functions” (6.7%), and “electric cooking pots”(6.4%), as well as proxy services like “cleaning services” (7.6%) and “housework services” (5.8%). This indicates that consumers are after products and services that can reduce the time and burden spent on housework. In addition, products that relieve fatigue and enable them to relax such as “massage machines” (7.5%) and “beauty appliances” (6.1%) were also observed. (Fig 5)
Fig 5
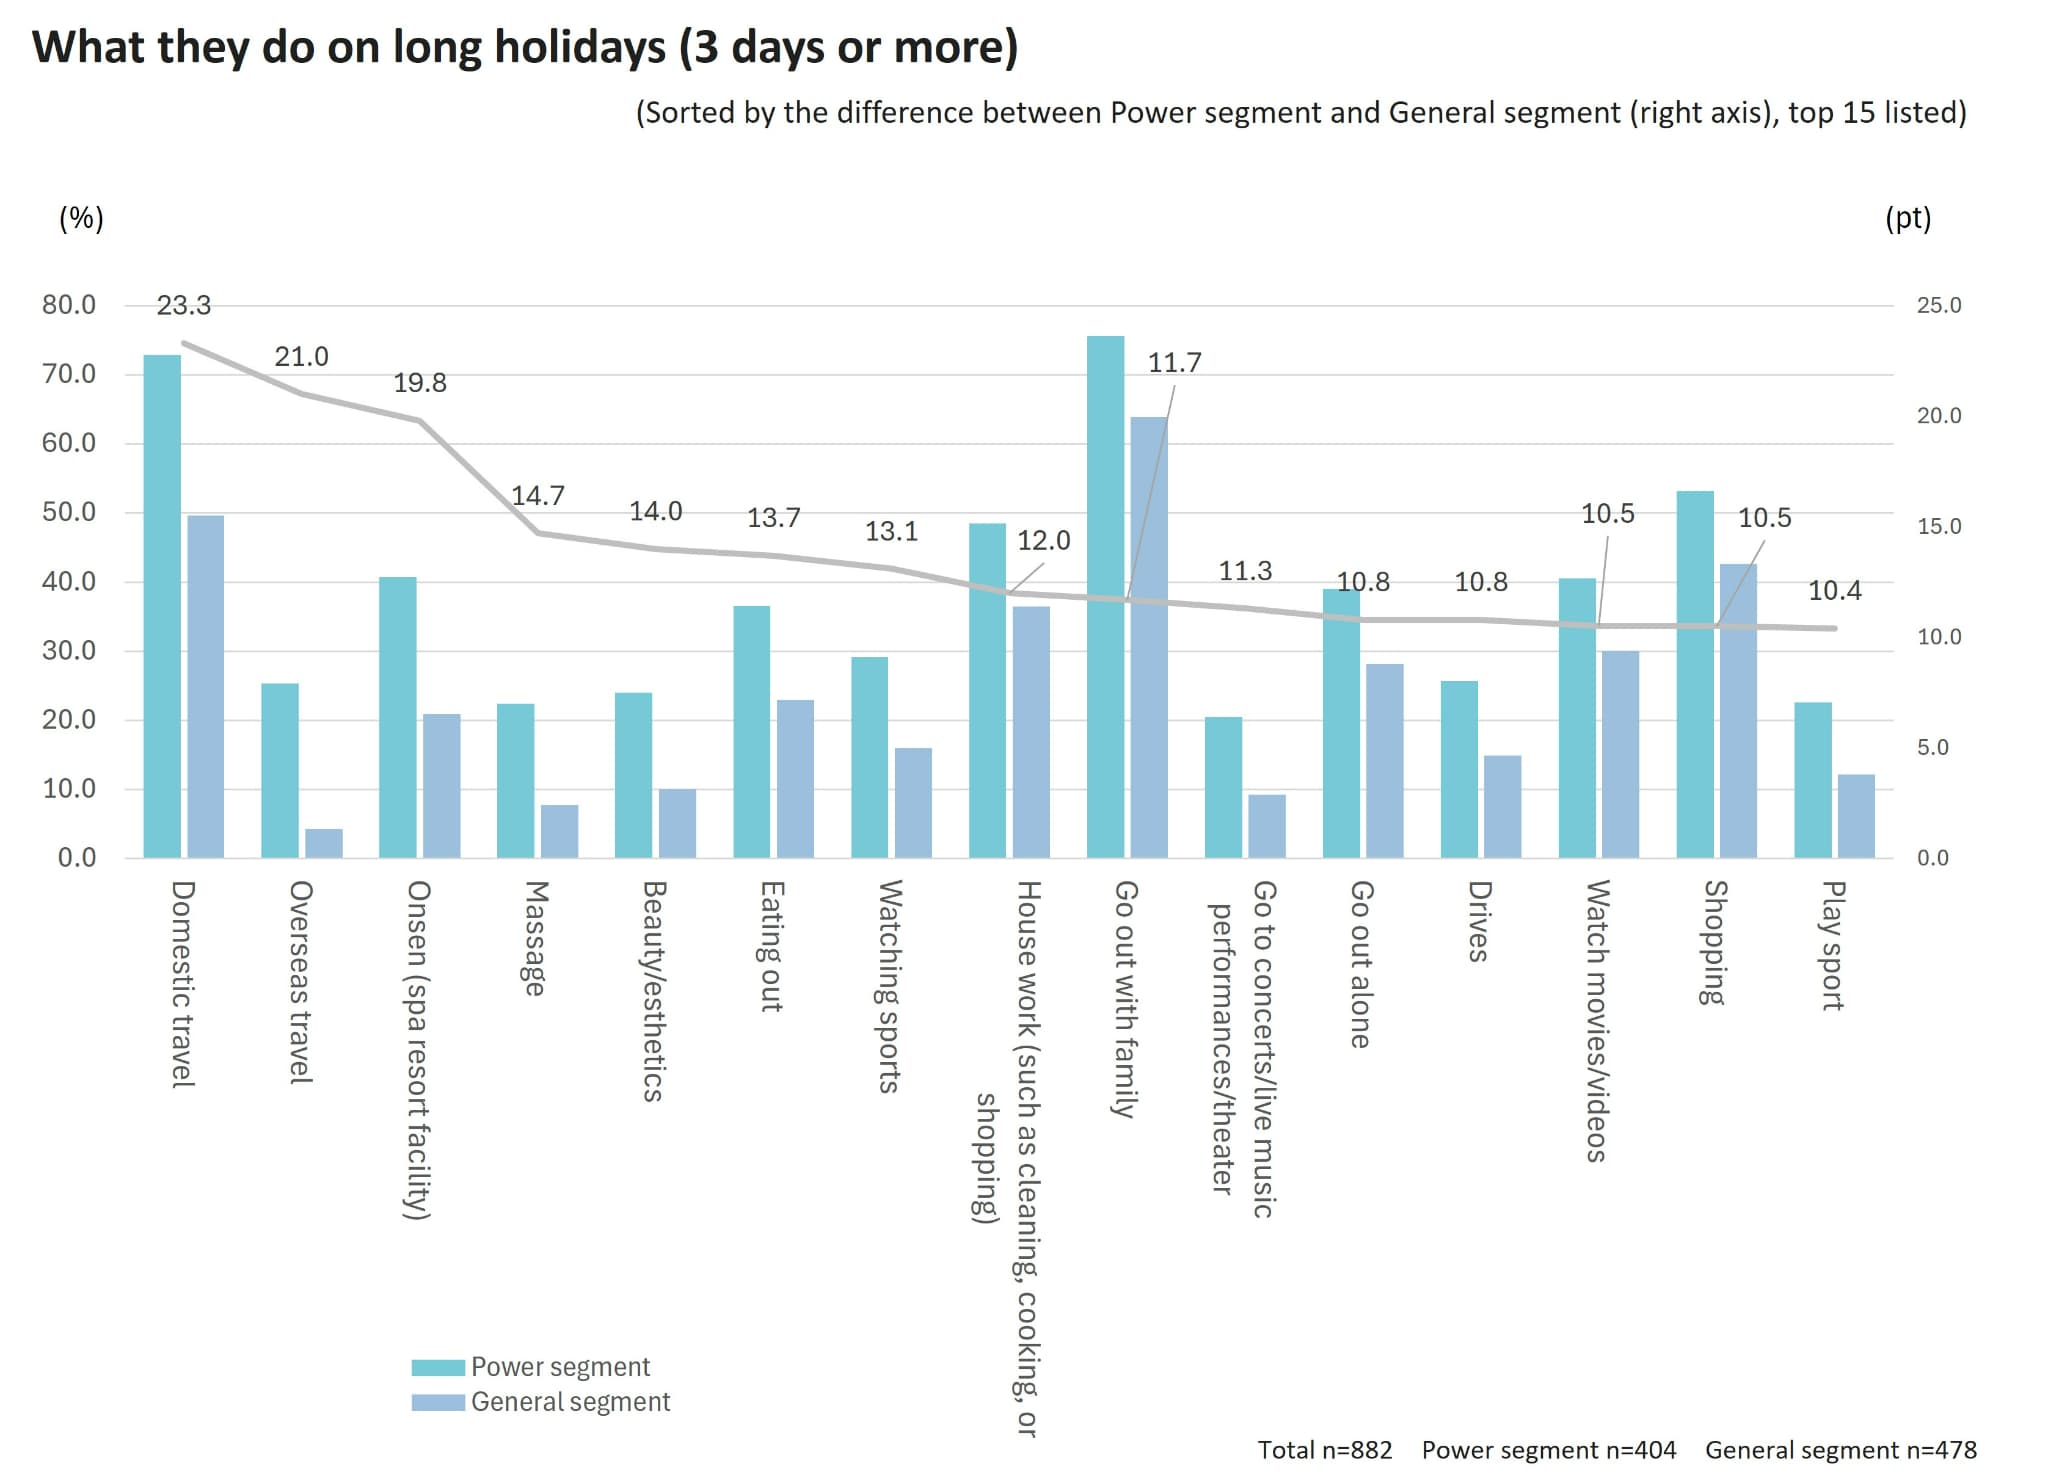
We next explored how the power segment spends leisure time and uses its time when they have 3 or more days off. The top behavior with the power segment was at first place “Going out with family” (75.6%), at second place “domestic travel” (72.9%), and third place “Shopping” (53.2%). The general segment are characterized by their top 1st and 2nd place behavior being the same, but 3rd being “sleeping” (47.1%). Fig 6 presents differences in behavior observed versus the general segment. The difference was most sizable in descending order in “domestic travel (a 23.3-point difference)”, “overseas travel (21.0-point difference)”, “hot springs/ bathing facilities (a 19.8-point difference)”, “massages (a 14.7-point difference)”, and “beauty/esthetics (a 14.0-point difference)”.
Fig 6
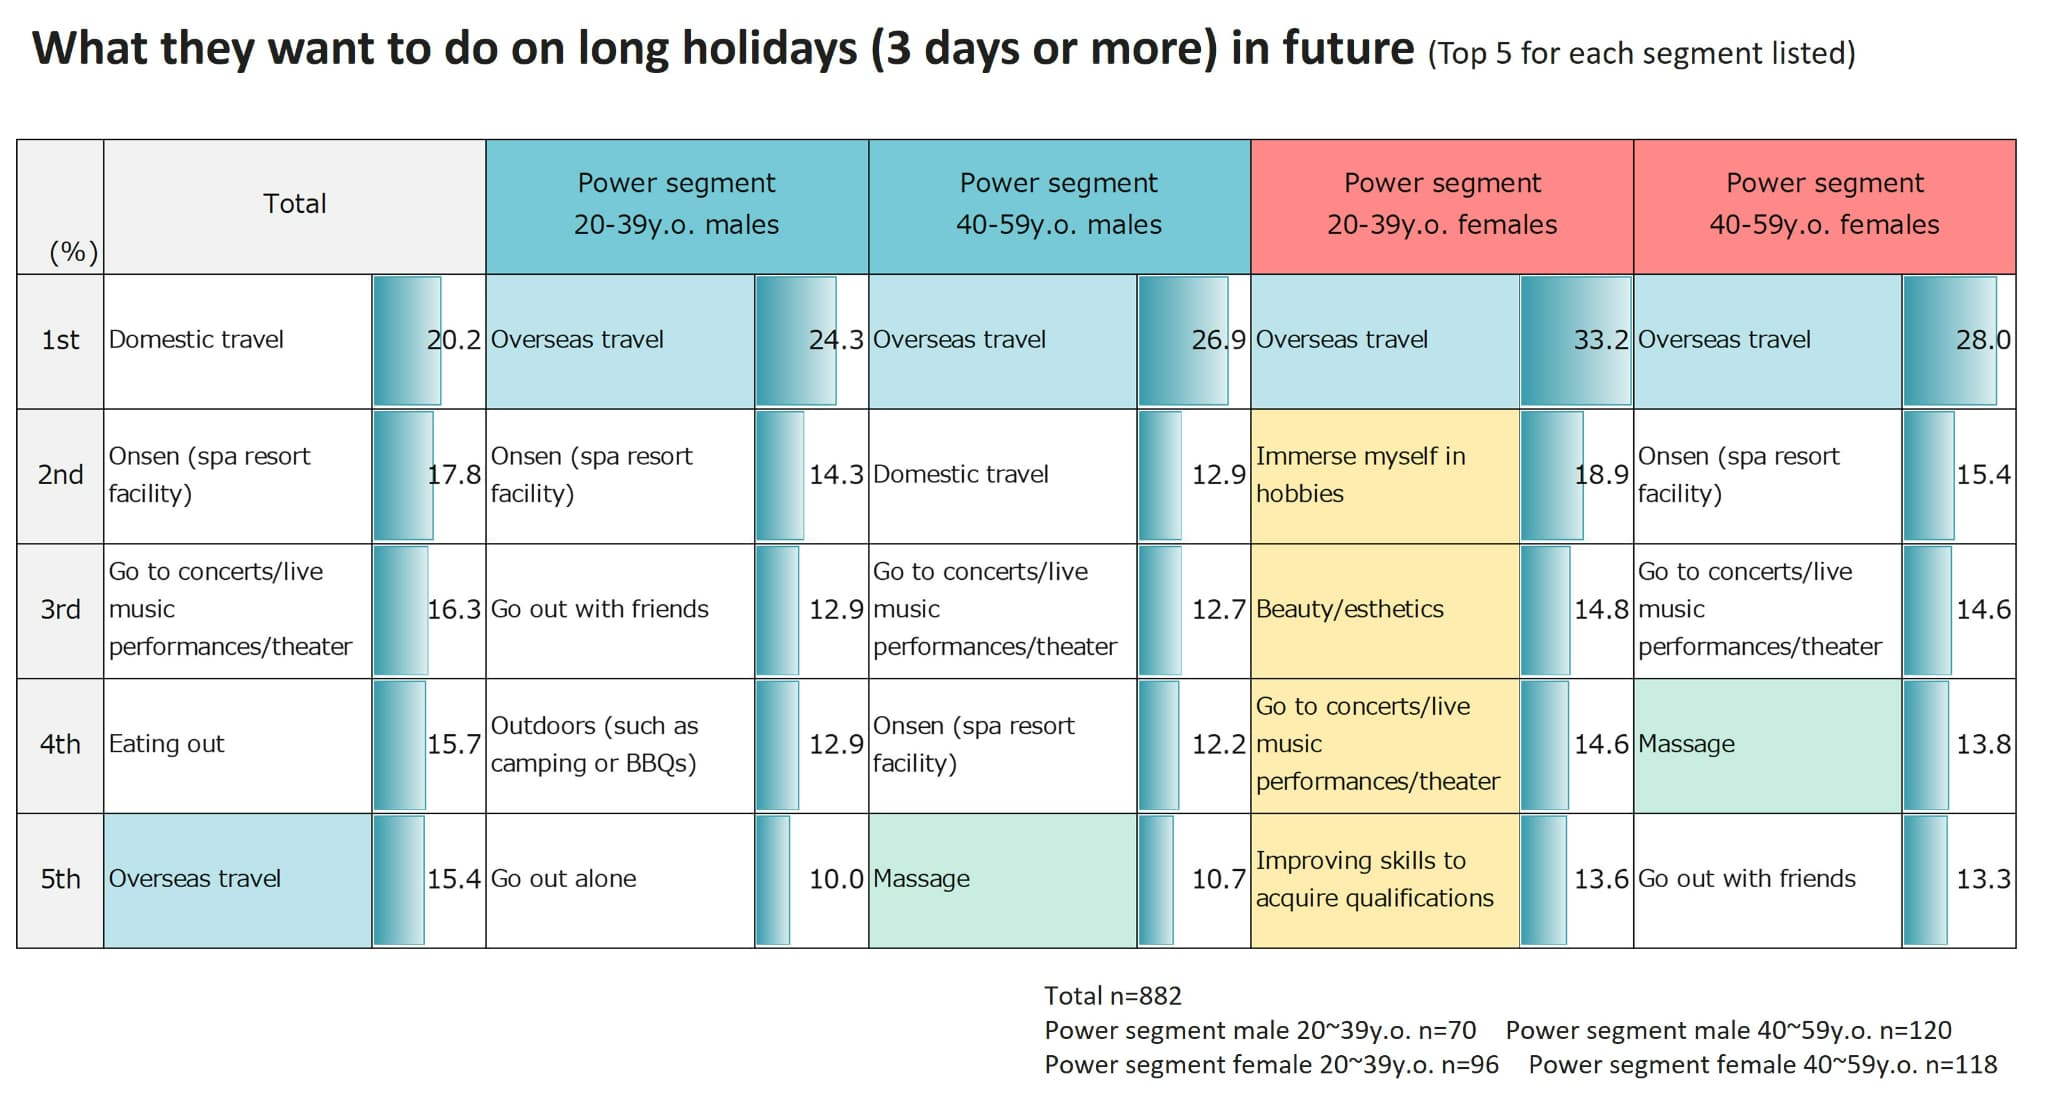
Conversely, when asked what they would like to do if they had three or more days off, young women aged 20 ~ 39 among the power segment gave “overseas travel” (33.2%), “spend time on hobbies” (18.9%), “beauty/esthetics” (14.8%), “go to concert performances” (14.6%), and “improve my skills to obtain qualifications” (13.6%) to a higher degree, with active behavior like self-0improvement, hobbies, and “supporting their favorite idols” ranking highly. (Fig 7)
Fig 7
The power segment is observed to take more active action on days off than the general segment, and are observed to spend more on leisure and services.
4. Power families & financial situations
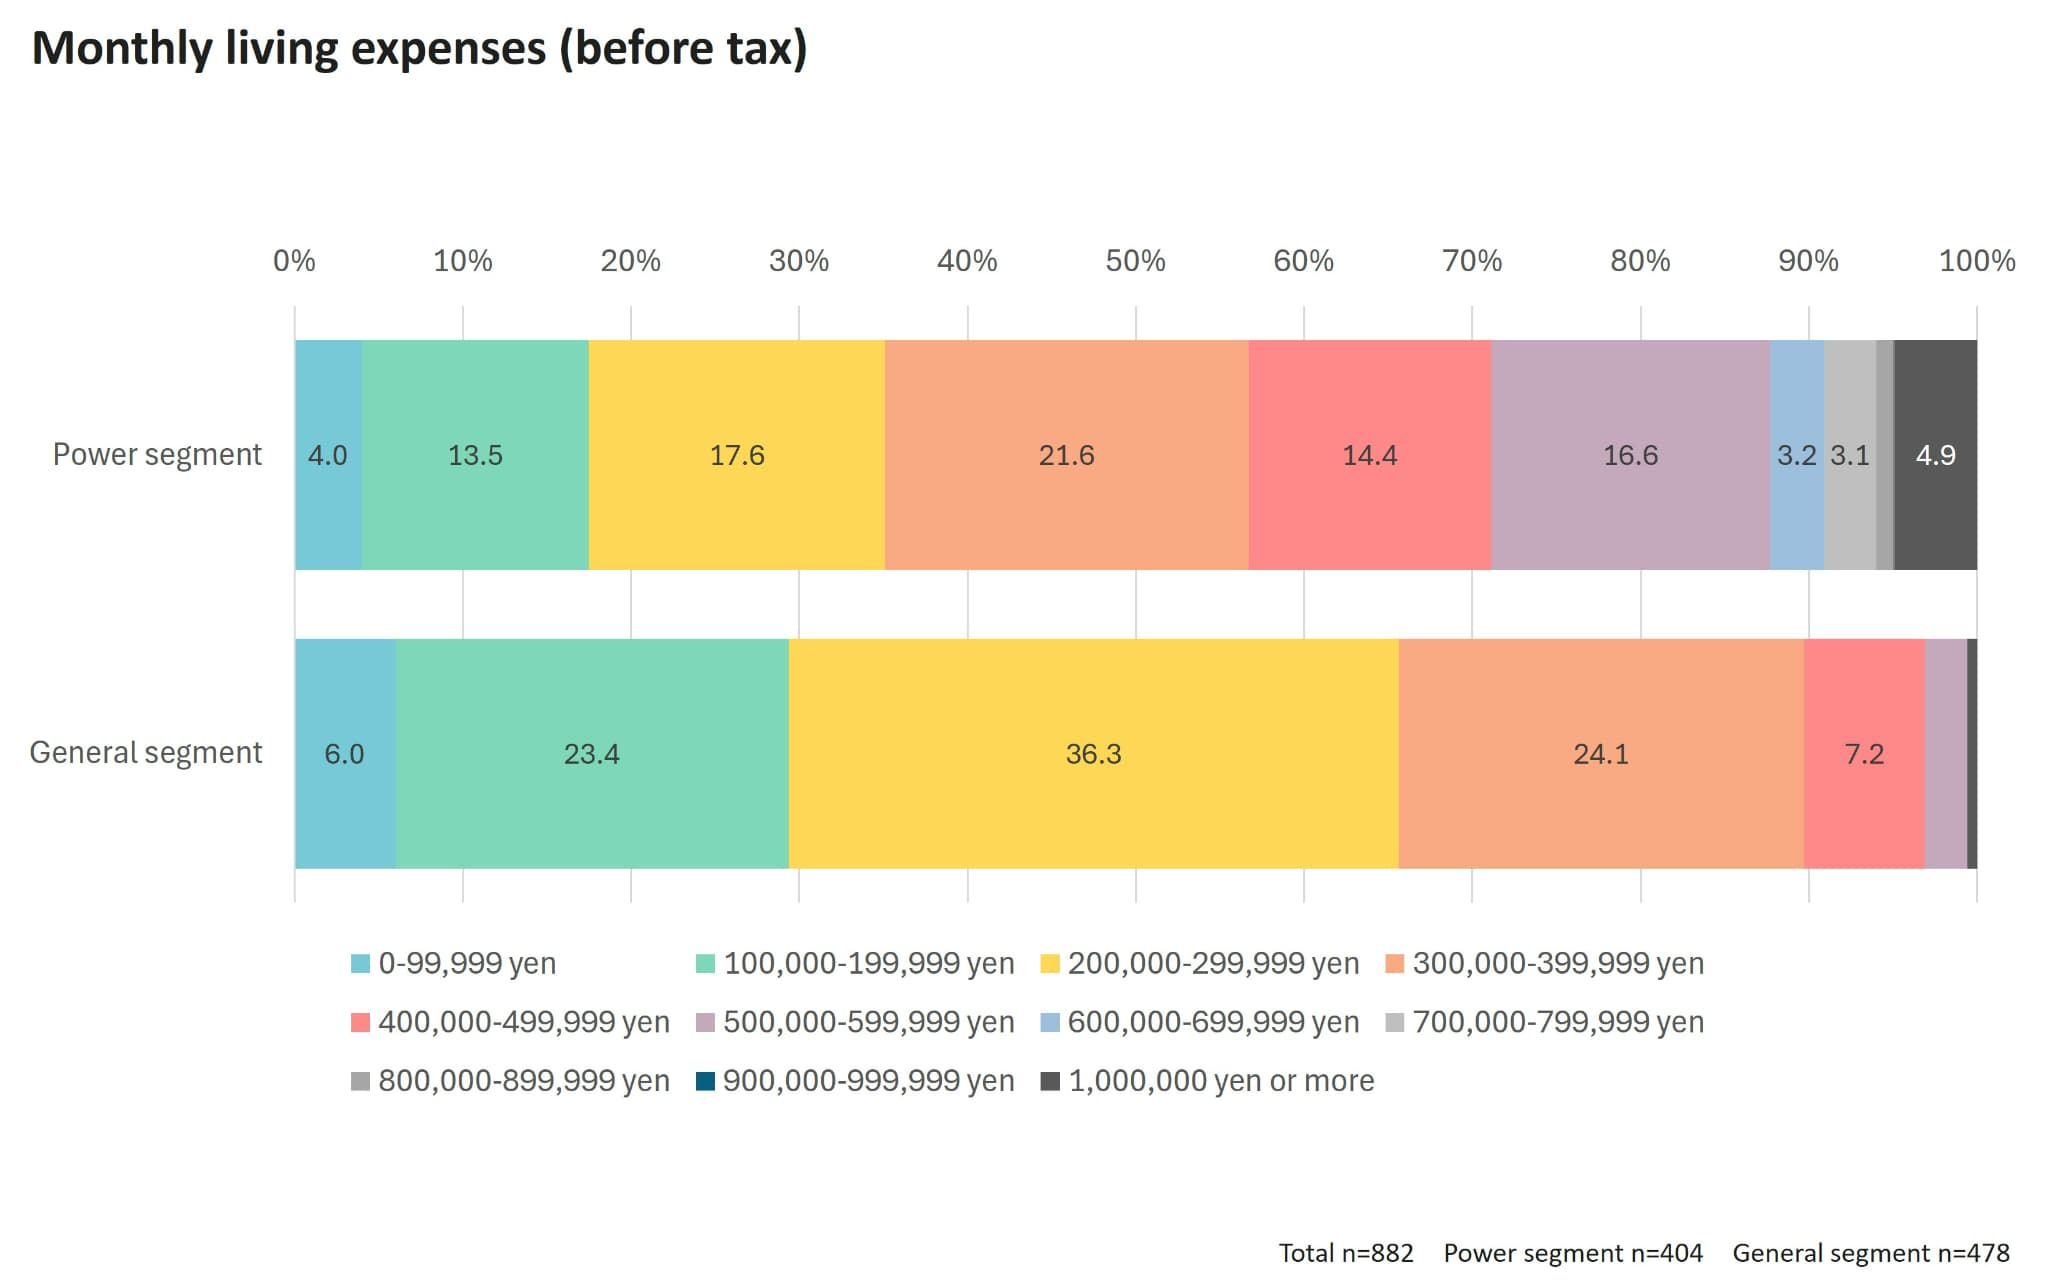
Lastly, we compared the financial situations of the power and general segments. The power segment’s average monthly living expenses (before tax) are 447,000 yen, compared to 256,000 yen for the general segment —a difference of 191,000 yen. (Fig 8)
Fig 8
In addition, the power segment had an average of 184,000 yen (including tax) they could freely use as individuals monthly, compared to the general segment at 82,000 yen. The power segment was 102,000 yen ahead here too. The power segment has 1.7 times more living expenses and 2.2 times more funds they can freely use as individuals. This difference appears to lead to their greater purchasing power.
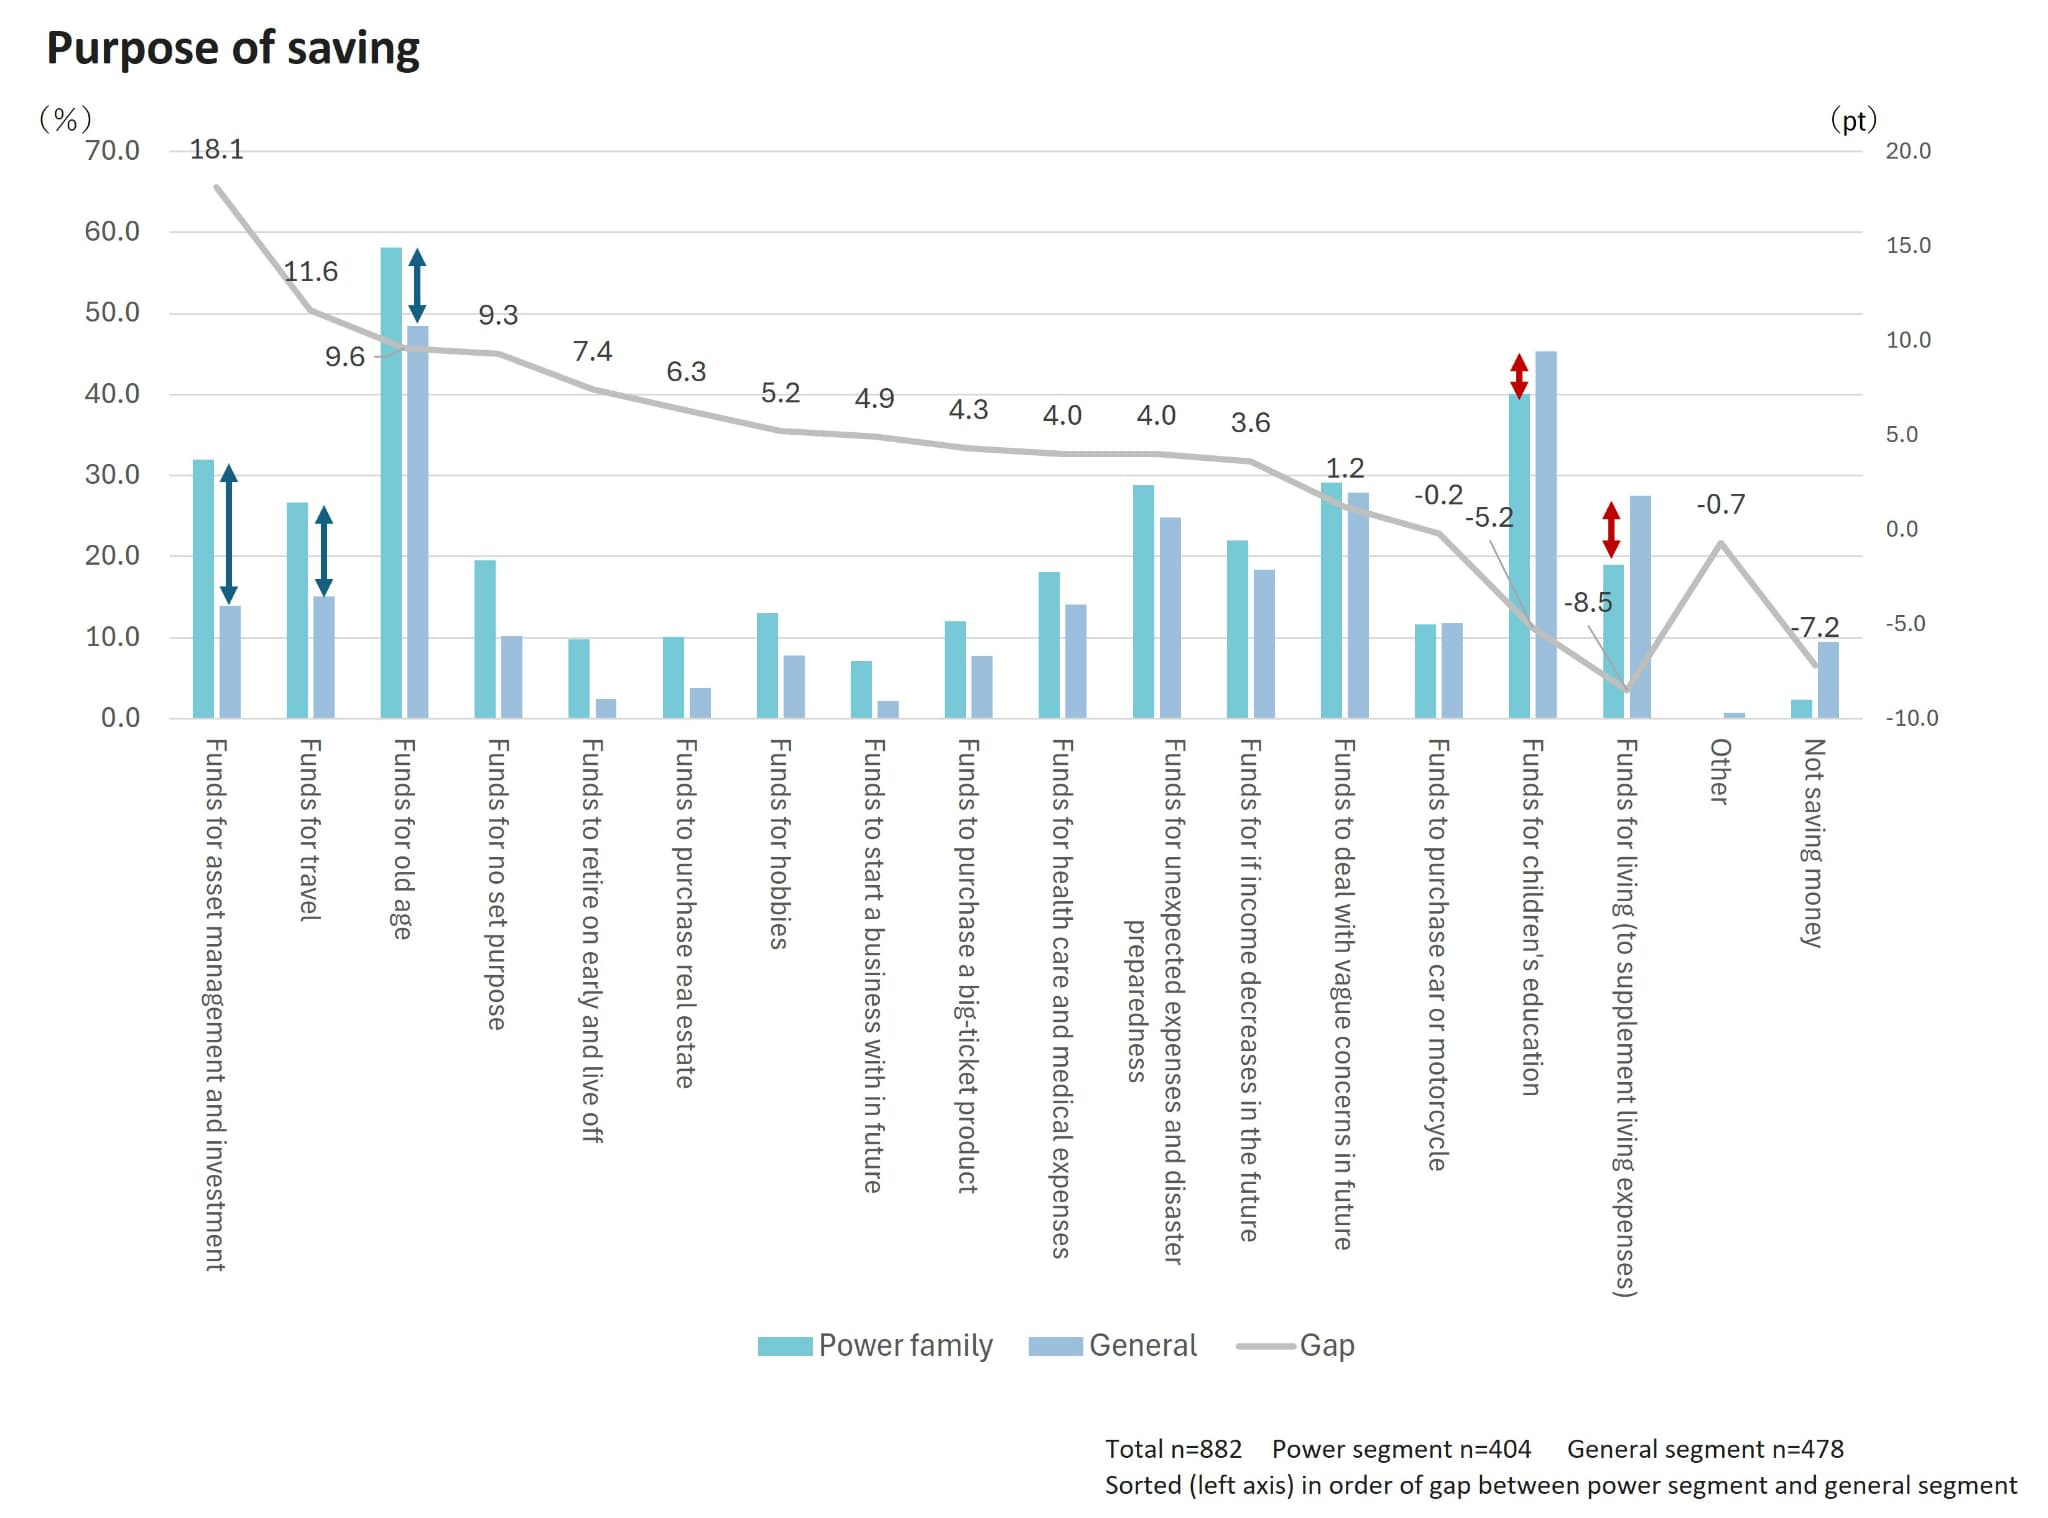
With savings as well, the power segment saved a ratio of 26.0% of their income, compared with the general segment at 14.4%, a gap of 11.6 points between the two. When examining the purposes of saving, the power segment and general segment differed sizably on “funds for asset management and investment (with the power segment 18.1 points ahead)”, “funds for travel (11.6 points ahead)”, and “funds for old age (9.6 points ahead)”, with the general segment conversely responding at a greater rate on “funds for living (to supplement living expenses) (with the general segment 8.5 points ahead)” and “funds for children’s education (5.2 points ahead)” (Fig 9). The power segment thus save for investment and entertainment purposes, while the general segment save funds for living and education.
Fig 9
5. Conclusion
Reflecting on the findings of this power families survey, the power segment has higher purchasing power due to its high annual household incomes, and because both spouses work fulltime, the driver to their affluent annual household incomes, they work hard to collaborate on housework and child rearing. To this end, they actively adopt home appliances and services such as a robot vacuum cleaners which make housework more efficient. And since they are normally busy, they actively spend time as a family on weekends as well. They want to save time and be more efficient precisely because they are busy, and use the free time this creates to live an active lifestyle, so identifying the “problems” and “needs” they face and resolving this with corporate technical, product, and service capabilities will lead to the creation of advanced products and services that match the times going forward. In addition, even if they do not have as high annual household incomes as the power segment, dual-income families are increasing, and it is becoming common for couples to share the housework, so saving time and making house work and child rearing more efficient are shared “problems” and “needs” they also face, so focusing on the power segment and taking measures with them should also provide a grasp on emerging trends. There are likely to be common “problems” and “needs” that exist not only in Japan, but in ASEAN (Association of Southeast Asian Nations) countries etc. that are also about to reach maturity, so products and services from Japan could lead the way globally. Placing the spotlight on power families and creating products and services that solve their “problems” could thus serve as a strategy for Japanese firms going forward.
Research outline Survey area: Nationwide, Japan Sample recruitment method: Eligible individuals recruited from Mighty Monitor Sample size: n=882 in total power segment n=404 general segment n=478 Tabulation weighted back* *Gender and age group composition ratios weighted back based on 2020 census data, taking into account demographic trends etc. to make composition ratios in 2024 Fieldwork period: (Fri) Sep. 6, 2024 ~ (Tue) Sep. 10, 2024
Author profile
Kentaro Hama
Future Co-creation Center, Sales Promotion Division, Marketing Partner Headquarters 2, INTAGE Inc.
・After graduating from university, Hama worked for a home appliance manufacturer, and was responsible for product planning for word processors, faxes, mobile phones, video communication devices, and solar power generation.
・Joined INTAGE in 2013, and engaged in domestic and overseas consumer research and consulting.
・Established the “Future Co-creation Center” in 2017, where he has conducted a large amount of joint research projects (POC) and consumer research with a focus on creating new value through co-creation with companies.
・Currently interested in the well-being field
Participating in Datability Consortium Organization
「Launched a “Well-being Committee” and is engaged in co-creation activities with different industries.
Reproduction and Quotation
◆This report is copyrighted by INTAGE Inc. Please check the following prohibitions and precautions, and specify the source when reproducing or quoting this report. “Source: INTAGE “Knowledge Gallery” article published MM/DD/YYYY article”
◆The following are prohibited: ・Alteration of this article in full or in part ・Sale or publication of this article in full or in part ・Uses that are against public order and morality, and uses connected with illegal activities ・Reproducing or quoting panel data* for the purpose of advertising or promoting companies, products, or services *Panel data include: SRI+, SCI, SLI, Kitchen Diary, Car-kit, MAT-kit, Media Gauge, i-SSP, etc.
◆Other precautions: ・INTAGE Inc. shall not be liable for any trouble, loss, or damage caused by the use of this report ・These usage rules do not restrict the use of quotations or other uses permitted under the Copyright Act of Japan
◆For inquiries about reproduction and quotation, click here