The year 2022 is coming to a close. What kinds of items were popular this year? Using the SRI+® (Nationwide Retailer Panel Survey), retail store sales data collected from approximately 6,000 stores nationwide, let’s take a look at what daily consumer goods sold particularly well.
Demand for OTC Drugs Increases as Cases Surge in the 3rd Year of the Pandemic
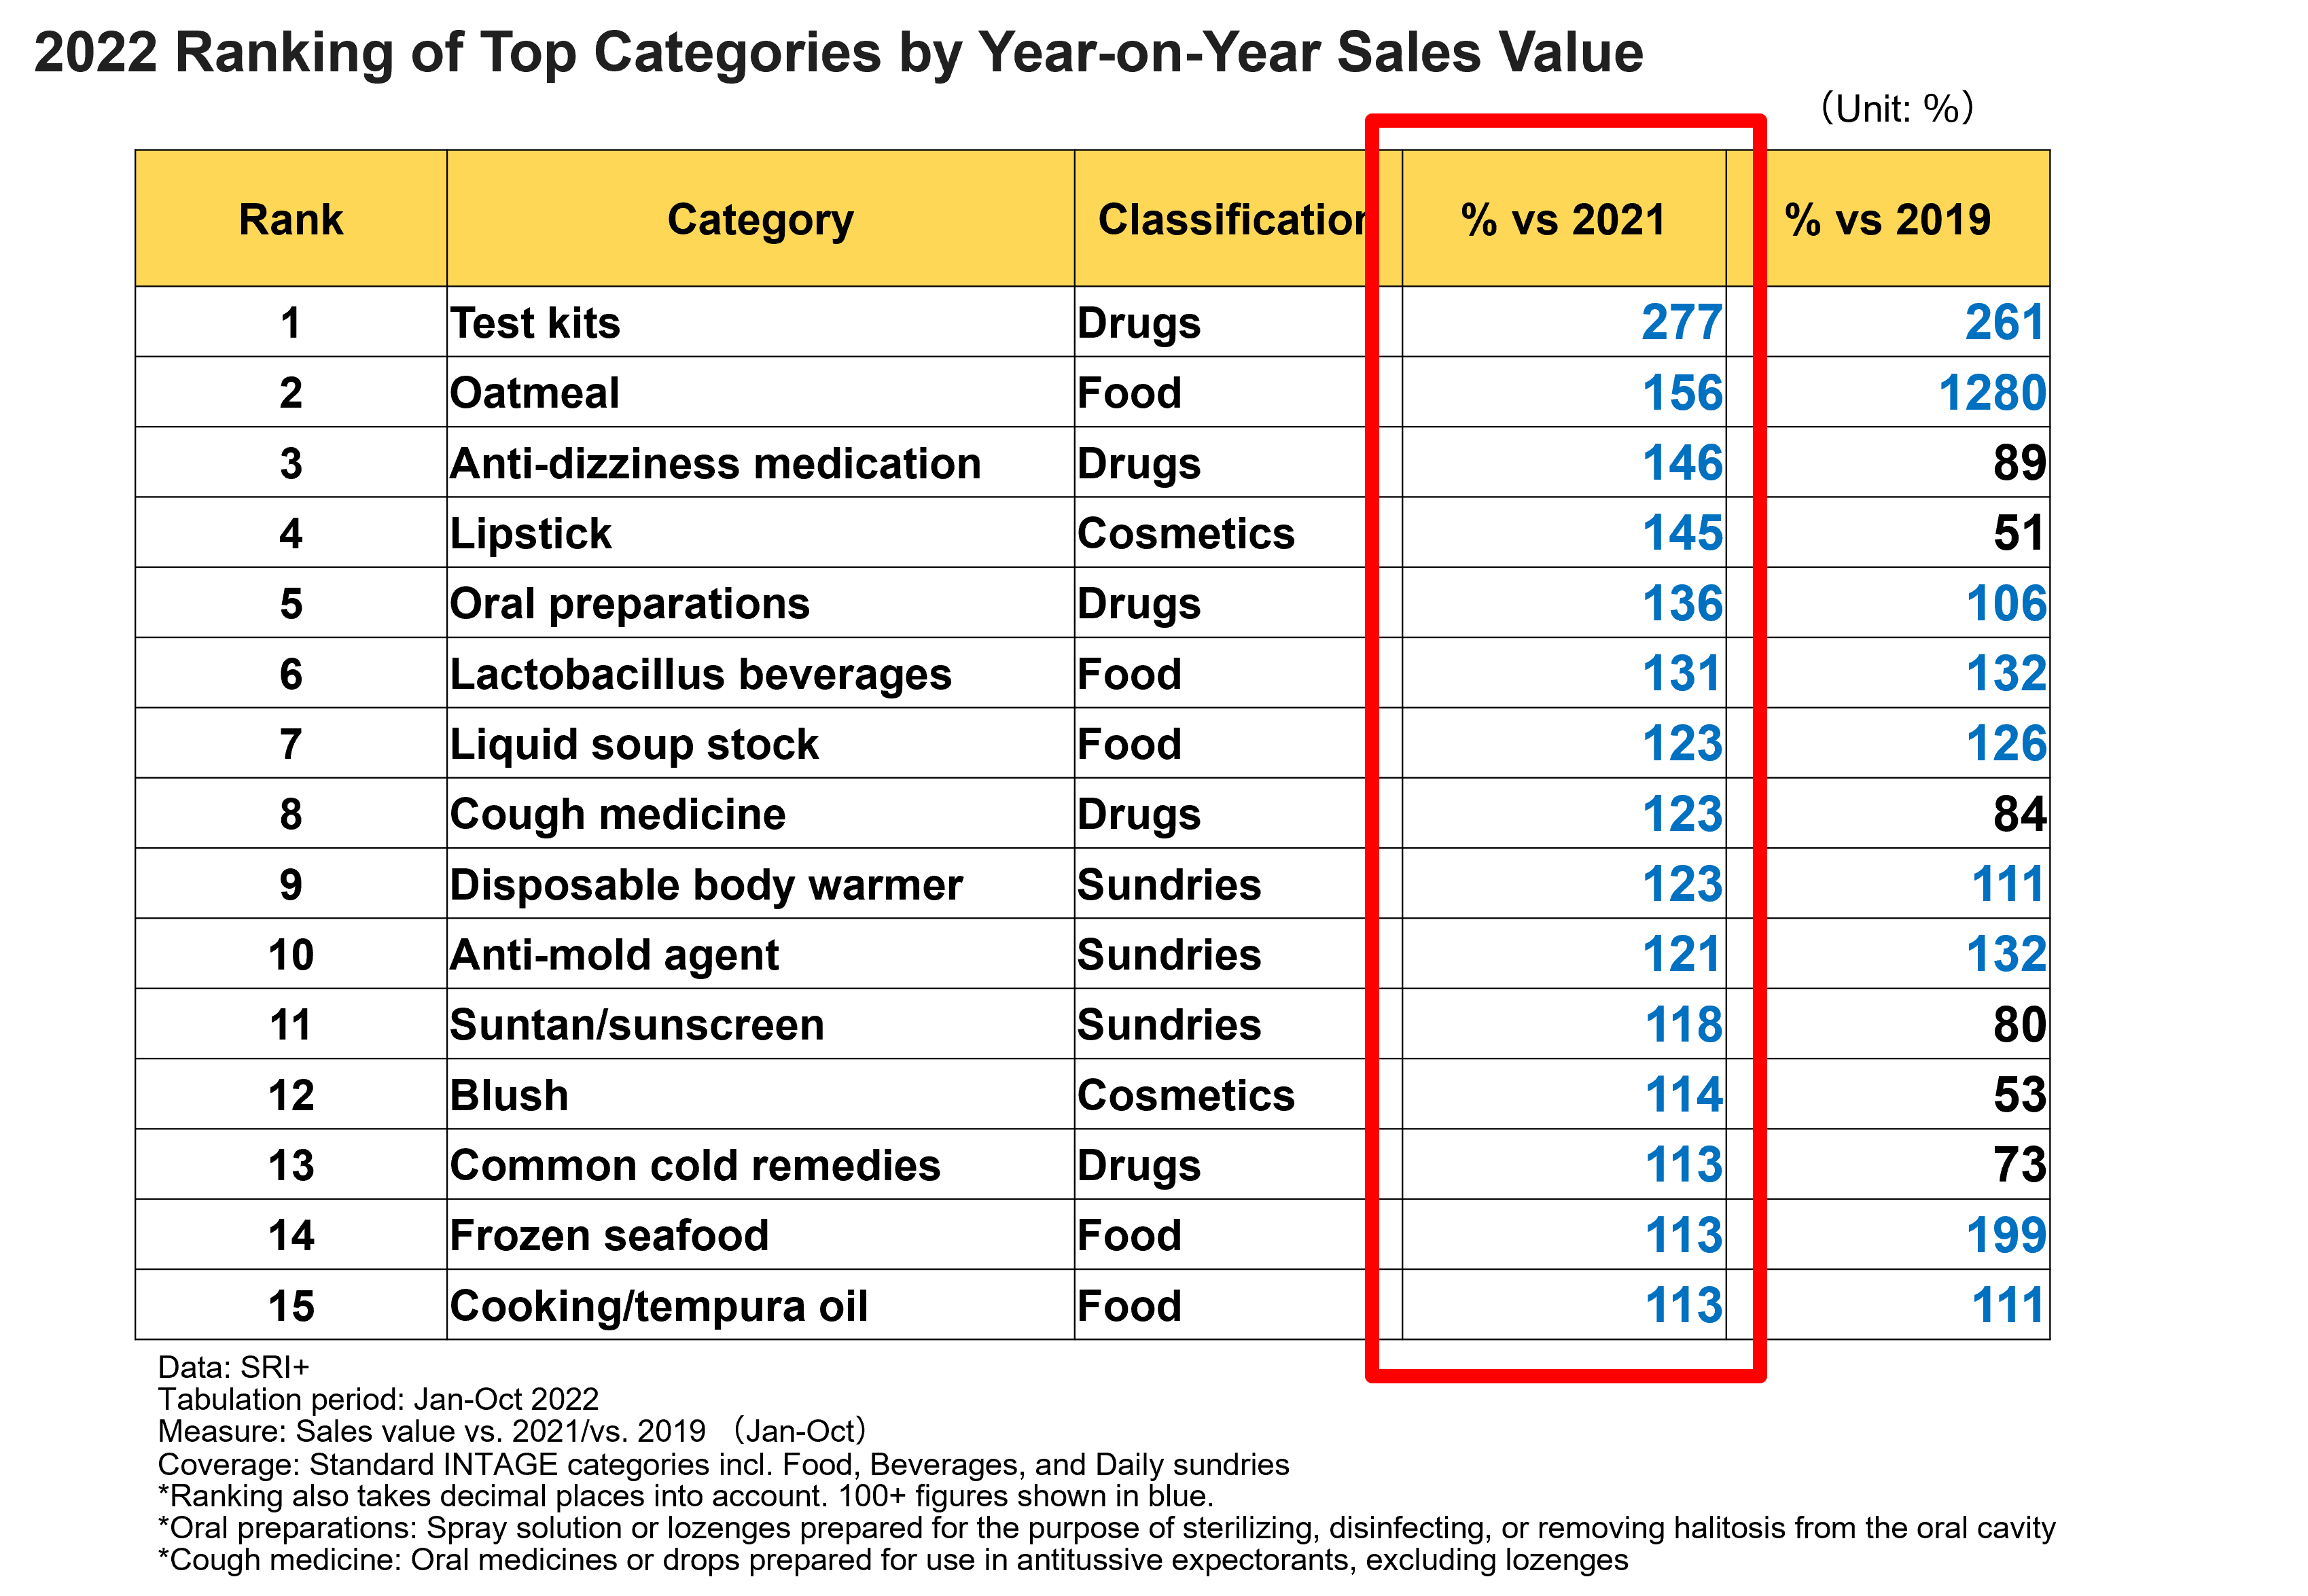
Fig. 1 shows the ranking by year-on-year sales value through October 2022.
Fig. 1
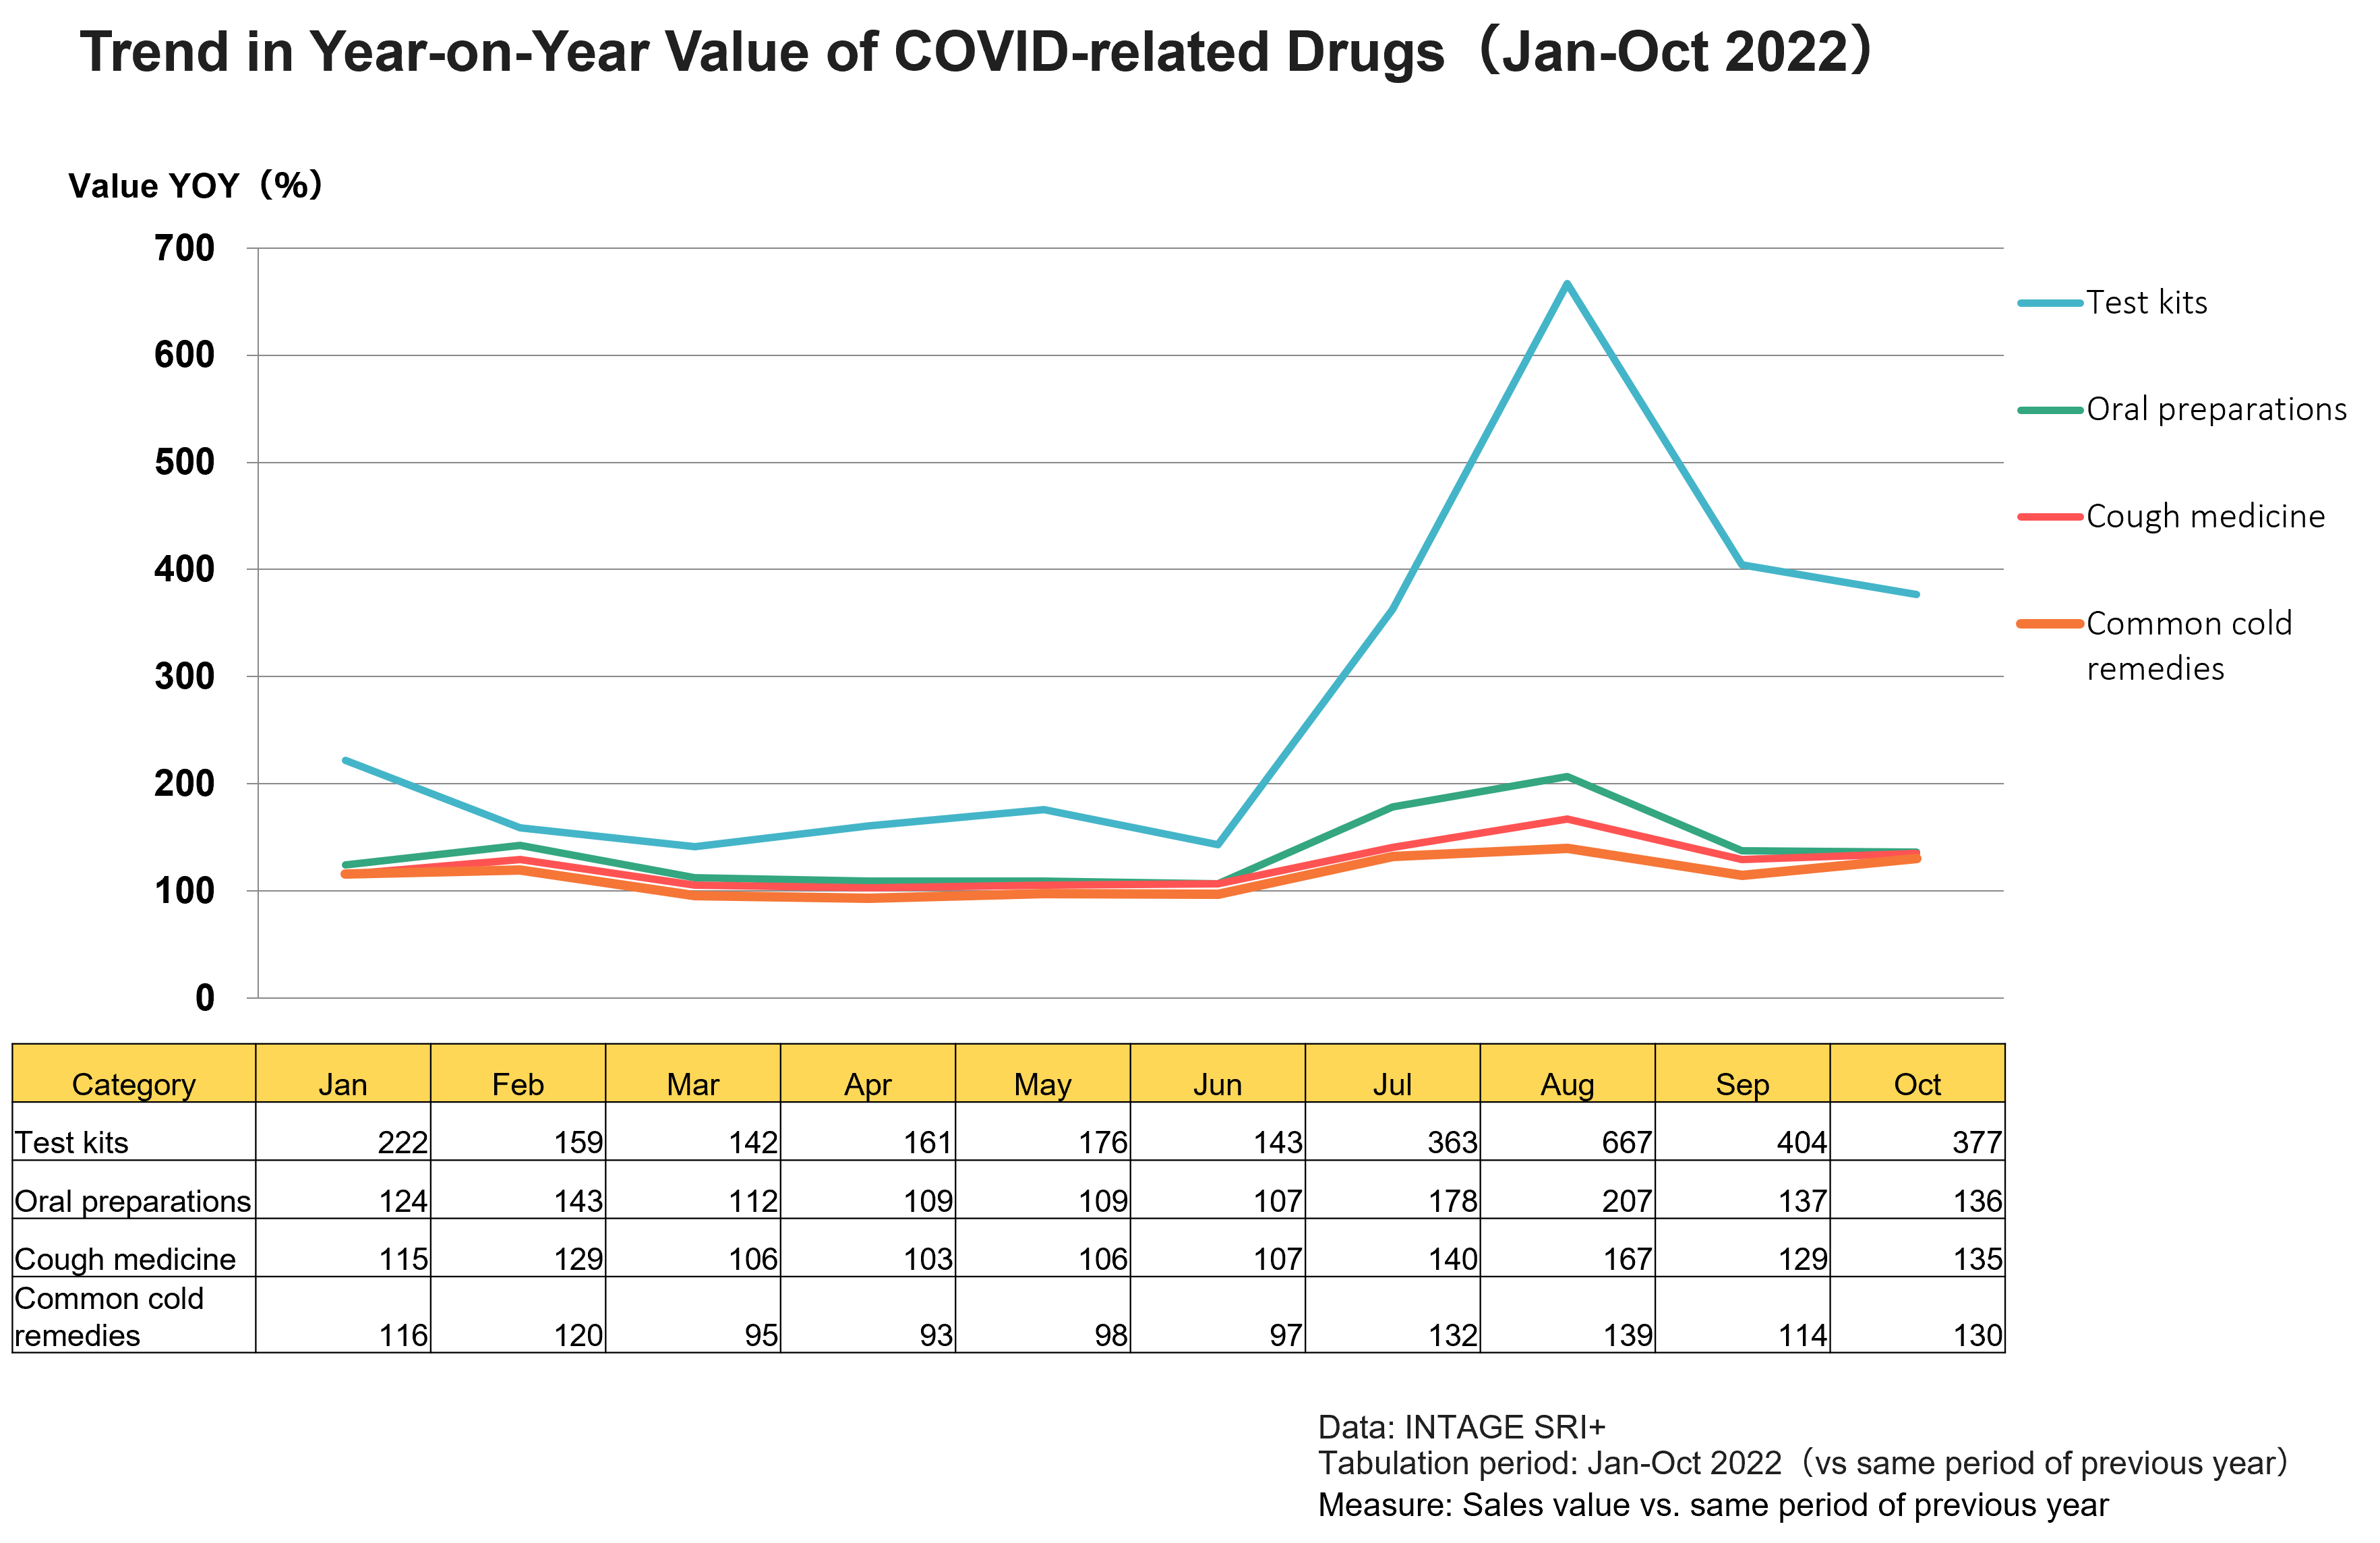
The no. 1 item is test kits, which saw a large rise in sales, to 277% of the previous year’s level. The main driver of this growth was the COVID-19 antigen test kit.*1 Sales began to surge from the summer (Fig. 2), with the 7th wave of the pandemic, rising to 363% in July and as high as 667% in August, and remaining at around 4 times the previous year’s level in September and October. Since the sales trend seems to correspond with the number of COVID-19 cases, demand seems likely to increase even more if the 8th wave continues to expand.
Fig. 2
Another category that has seen pandemic-driven sales growth is OTC drugs. One characteristic of the Omicron variant is its tendency to cause “severe sore throat”, and sales of oral preparations, at no. 5, were at 136% year-on-year, and nearly double the previous year’s level in July and August. Similarly, sales of cough medicine (no. 8), which suppress coughs and facilitate expectoration of phlegm from the throat, rose to 123% of the previous year’s level, and general cold remedies (113%/no. 13), which had been sluggish due to heightened hygiene awareness, saw particularly large sales growth from July.
In 2022, the Omicron variant led to the spread of infection on a scale never seen before, making it difficult to see a doctor. At the same time, the likelihood of life-threatening illness declined, and it seems that a certain number of people at low risk of developing severe symptoms, considering the possibility that they would not be able to see a doctor, took preparatory actions on their own, testing themselves and buying medication in advance. Demand for these high-ranked medications seems likely to remain high for the foreseeable future.
Top-Selling Foods Deliver “Healthy and Convenient Authenticity”
Oatmeal (no. 2) is arguably one of the pandemic’s most successful products in terms of sales. This year’s sales are at 156% year-on-year, but compared to the pre-pandemic level of 2019, the figure is 1280%. In just three years, the market has grown by a factor of more than 10. Due in part to growth in demand as a food for losing weight (gained during the pandemic) and promoting intestinal activity, the no. of female users in particular has increased, and it is also being consumed in a greater variety of ways, including adding water and heating it like rice, making it into something that people eat not only for breakfast but also at lunch and dinner. Lactobacillus beverages (131%), in 6th place, saw sales boosted by products claiming to be effective for sleep problems and stress during the pandemic. They seem to have gained the acceptance of consumers as an easy-to-ingest item in the midst of various pandemic-related changes and concerns such as working from home, the threat of infection, and having fewer opportunities to go out.
Two other food/beverage categories that appear to have grown as a result of the pandemic are liquid soup stock (123%) and frozen seafood (113%), ranked 7th and 14th, respectively. Liquid dashi (soup stock), which has gained a reputation as a convenient way to create an authentic taste at home, is growing in popularity. Along with frozen food, another item that conveniently gives dishes a more upscale feel, liquid dashi may have become a new fixture in many households.
Cosmetics Showing Signs of Recovery as People Go Out More
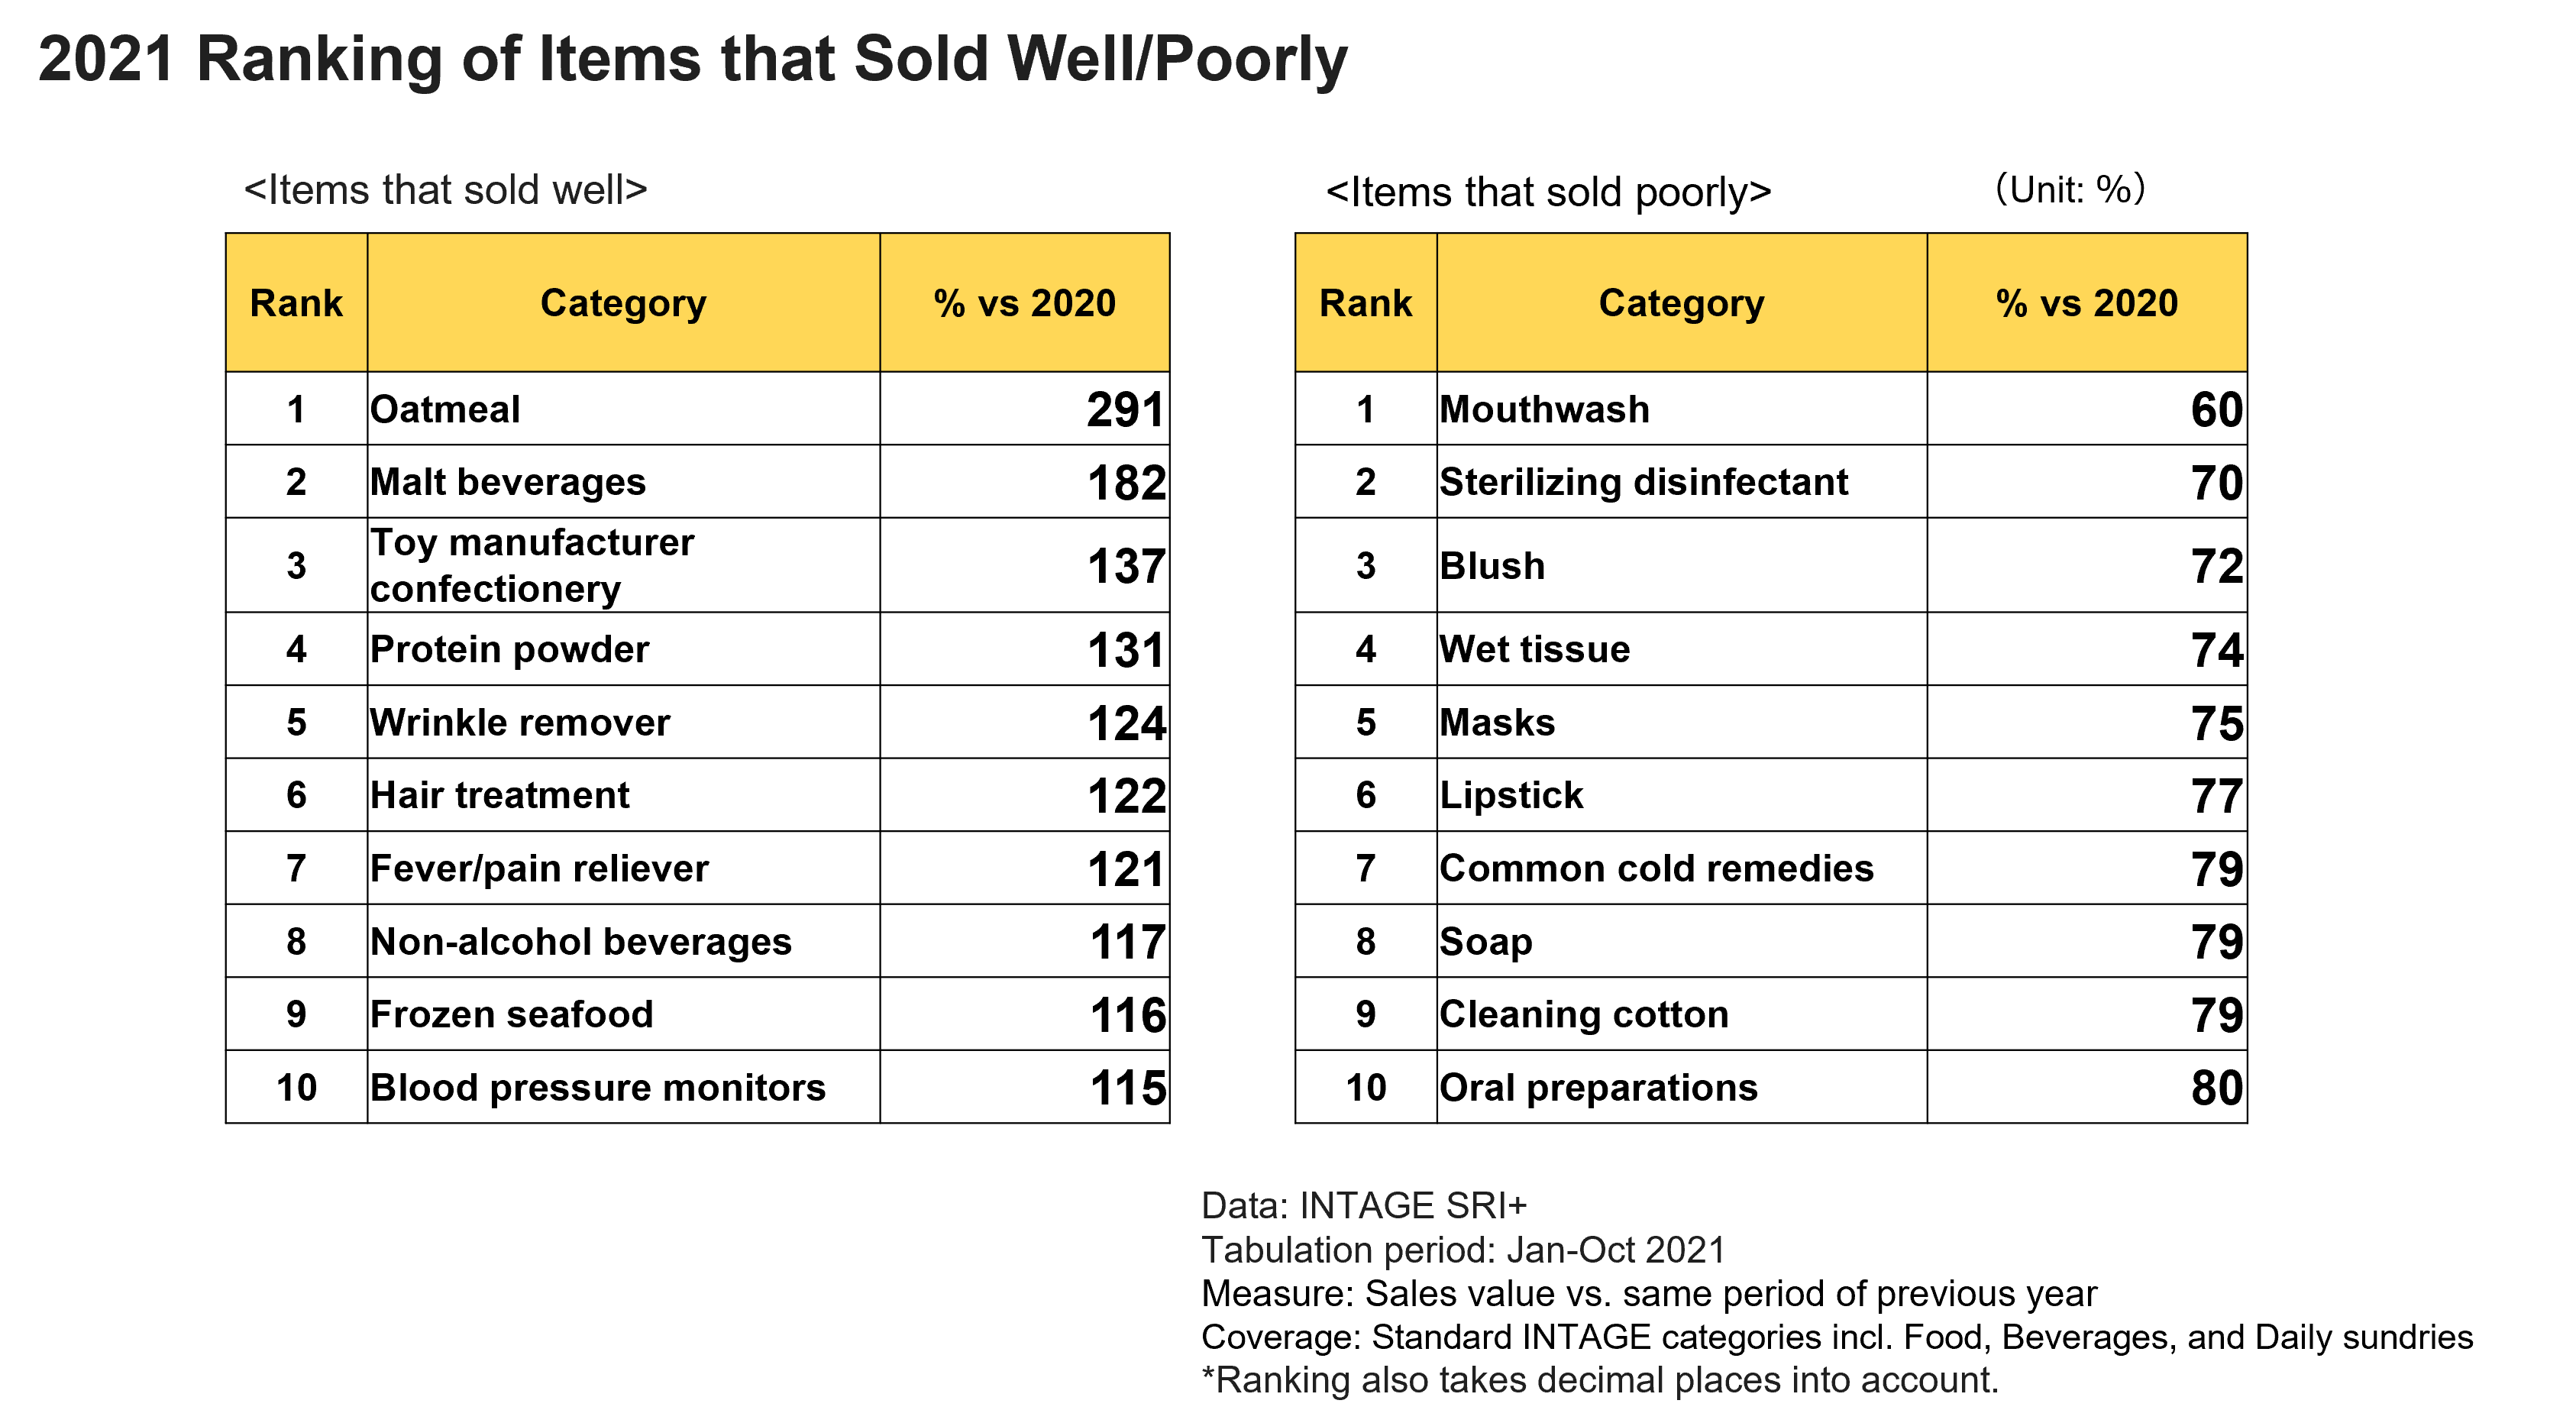
In order to see what has changed from last year, let’s take a look at the Top 10 rankings of categories that sold well and categories that struggled in 2021 (Fig. 3). While some categories—such as oatmeal, which was no. 1 last year and no. 2 this year—have continued to sell well, one noteworthy difference is the presence of blush and lipstick—cosmetics for areas that are hidden by masks—at no. 3 and no. 6, respectively, in the “struggling sales” ranking.
Fig. 3
These two categories are among the top sellers this year, with lipstick in 4th place at 145% and blush in 12th place at 114%, suggesting that the market is recovering. An increase in opportunities to go out, along with the easing of mask-wearing rules, appear to be contributing factors.
Along with lipstick, another item that serves as a barometer of the extent to which people are going out is anti-dizziness medication, which includes products for motion sickness. Anti-dizziness medication is at no. 3 in this year’s ranking, with sales value at 146% of the 2021 level, suggesting that travel and other leisure activities were thriving due to travel support programs offered by local governments and other organizations. Disposable body warmers, in 9th place at 123%, and suntan/sunscreen, in 11th place at 118%, are also products that see an increase in demand as people go out more. This was a year that saw the return of many events and festivals, and “for the first time in 3 years” was an often-heard phrase. It seems that while people are still taking preventive measures, they are starting to go out again as they adjust to “life with COVID”.
Another notable topic this year is the presence of cooking/tempura oil (113%) at no. 15. Despite a 6% decrease in sales volume, sales value increased by more than 10%. Cooking oil is one category in the food and daily sundries market that has seen remarkably large price increases. As of October 2022, the retail price of canola oil, a widely-used cooking oil, was 1.8 times higher than the average price in 2020, when price hikes began to be implemented. With price hikes expected to continue, the impact of these changes will require further attention.
Some Categories Continue to Struggle Due to Drop-off from COVID-related Demand
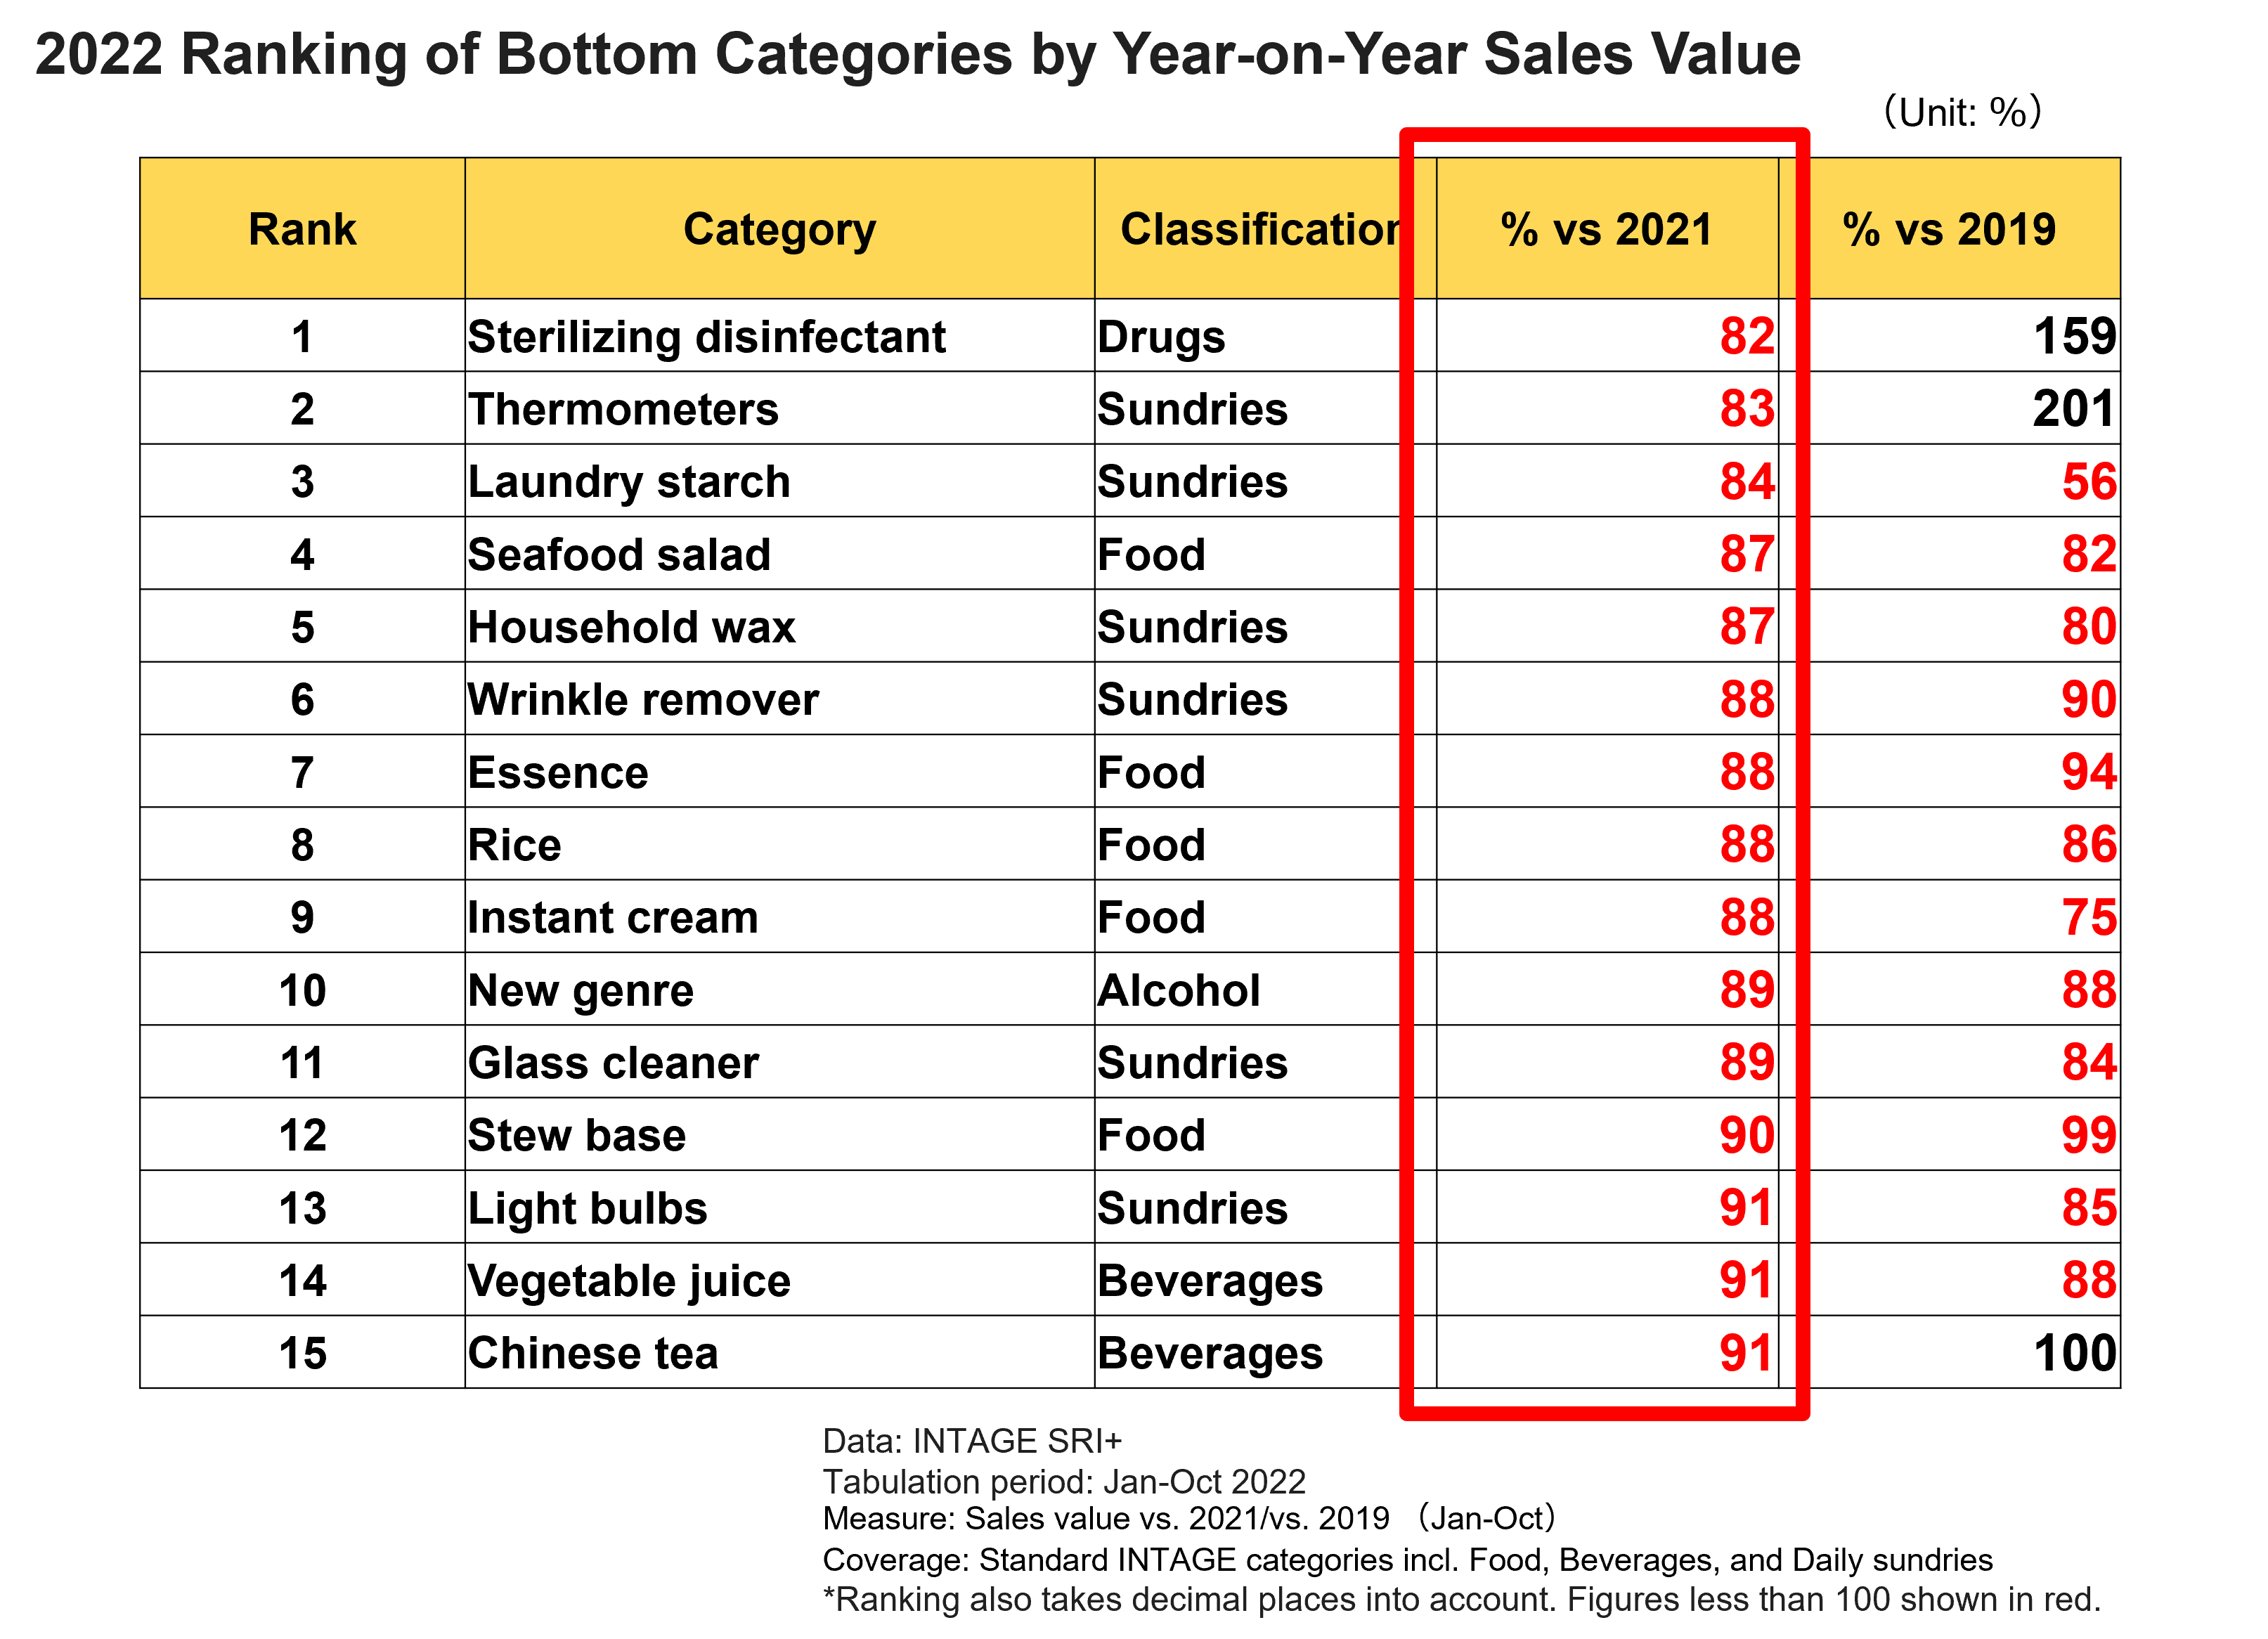
Finally, let’s take a look at the categories that struggled the most in terms of sales (Fig. 4).
Fig. 4
The no. 1 category is sterilizing disinfectant (82%). This category includes hand sanitizers, which at the start of the pandemic became available whenever we entered a building or room, and the drop-off in sales may be due to declines in usage frequency and in the number of people who carry it around. Thermometers, at no. 2, are down since this is an item that does not need to be purchased again once it is bought, but comparison to the pre-pandemic level shows large growth (201% vs. 2019). Other high-ranking products include laundry starch at no. 3 (84%), seaweed salad at no. 4 (87%), and rice at no. 8 (88%), all of which have remained on a downtrend. Wrinkle remover (88%), ranked no. 6, is an item for clothes that sold well last year due to products claiming to have a virus-removing effect, but the category did poorly this year partly as a reaction to last year’s strong sales.
Sales declines were also observed in “stay at home”-related categories such as household wax (87%) at no. 5, essence (88%) at no. 7, and glass cleaner (89%) at no. 11, suggesting that pandemic-driven “special demand” is subsiding as people gradually return to their daily routines.
This year’s rankings show that, in the third year of the pandemic, people are adjusting to life with COVID in different ways, adopting preventing measures on their own as they go out more and more. In addition, there have been a number of changes over the past few years that have had a significant impact on people’s lifestyles and consumption behavior. One of these is price hikes, which have been implemented at a rapidly expanding pace since the end of last year. In the Knowledge Gallery, we will continue to examine changes in consumers as revealed through “best-selling items”.
SRI+® (Nationwide Retailer Panel Survey) SRI+®, the No. 1 retailer panel in Japan*1 in terms of sample size and chain coverage, continuously collects daily retail sales data from approximately 6,000 stores nationwide, including supermarkets, convenience stores, home centers/discount stores, drugstores, and specialty shops. The data collected by SRI+® is statistically processed and no information that would identify the stores in the panel is disclosed. *: As of December 2022
*1: The “COVID-19 antigen test kit” products included in the test kit category are limited to products that we were able to identify as being for medical and general use (OTC), and does not include antigen test kits for research use.
Reproduction and Quotation
◆This report is copyrighted by INTAGE Inc. Please check the following prohibitions and precautions, and specify the source when reproducing or quoting this report. “Source: INTAGE “Knowledge Gallery” article published MM/DD/YYYY article”
◆The following are prohibited: ・Alteration of this article in full or in part ・Sale or publication of this article in full or in part ・Uses that are against public order and morality, and uses connected with illegal activities ・Reproducing or quoting panel data* for the purpose of advertising or promoting companies, products, or services *Panel data include: SRI+, SCI, SLI, Kitchen Diary, Car-kit, MAT-kit, Media Gauge, i-SSP, etc.
◆Other precautions: ・INTAGE Inc. shall not be liable for any trouble, loss, or damage caused by the use of this report ・These usage rules do not restrict the use of quotations or other uses permitted under the Copyright Act of Japan
◆For inquiries about reproduction and quotation, click here