Food + Beverage + Liquor Market to Shrink by Almost 10% by 2030
In 2022, the number of births fell below 800,000, the lowest number since statistics were first compiled in 1899. Estimates released in 2017 by the National Institute of Population and Social Security Research stated that the population would fall below 800,000 in 2033, which means that the pace of population decline is 11 years faster than expected. In addition, as policies related to social security are discussed and reported, the “population problem”, which includes not only the declining birthrate but also the aging of the population, is attracting attention.
As the population declines, the number of stomachs will also decline; moreover, as people get older, they eat less. Therefore, as the population ages, food and beverage-related markets can be expected to shrink.
Given this situation, based on INTAGE consumer panel SCI*1 data for 2012~22, we used Bayesian cohort analysis (details below) to forecast the size of the Food + Beverage + Liquor market in 2030, when the population problem will have progressed even further.
“Population aged 15~79” and “Food + Beverage + Liquor Market Size” in 2030
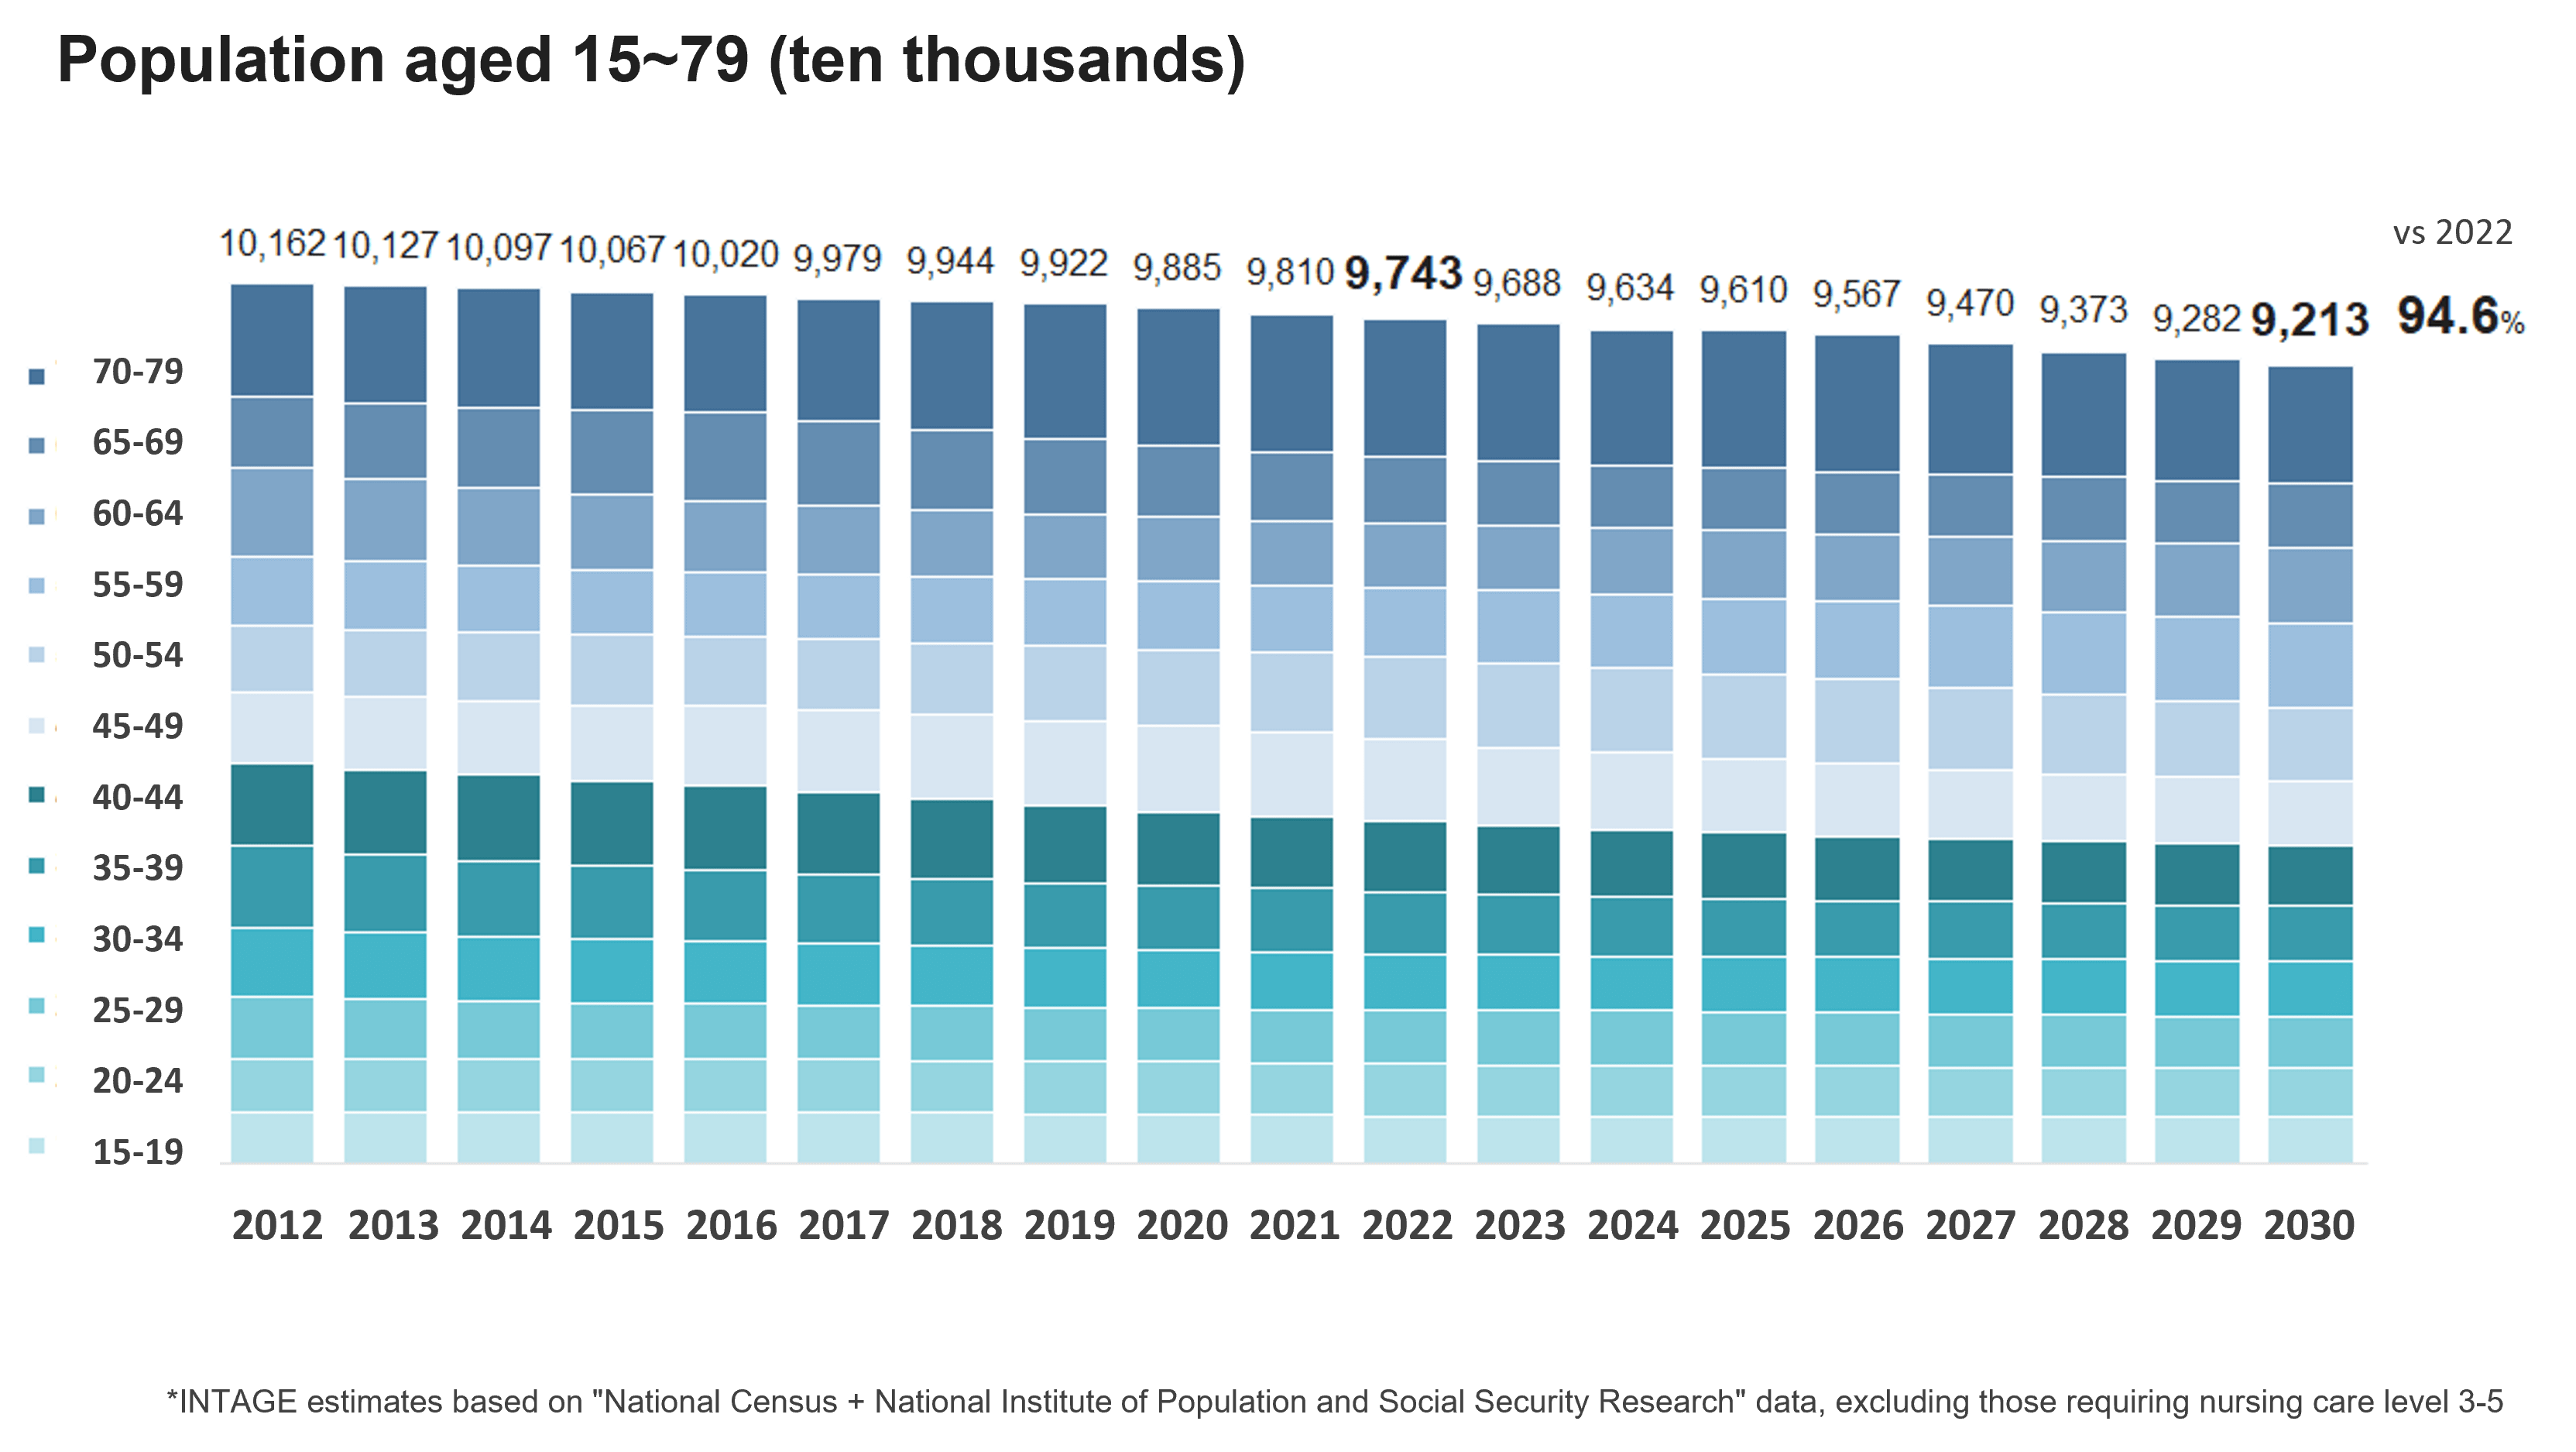
We estimated the market size based on the spending (purchase value) of men and women aged 15~79, who are the main drivers of domestic consumption. First of all, let’s take a look at the 15-79 year old population that is the basis of this analysis.
Fig.1 shows the population (excluding those requiring nursing care level 3-5) between 2012 and 2030 as estimated by INTAGE based on figures from the National Census and the National Institute of Population and Social Security Research. Since the baby boomers (born in 1947~49) will be 81~83 years old in 2030, the population aged 15~79 is expected to be 94.6% of the population in 2022, a decrease of 5.4%.
Fig.1
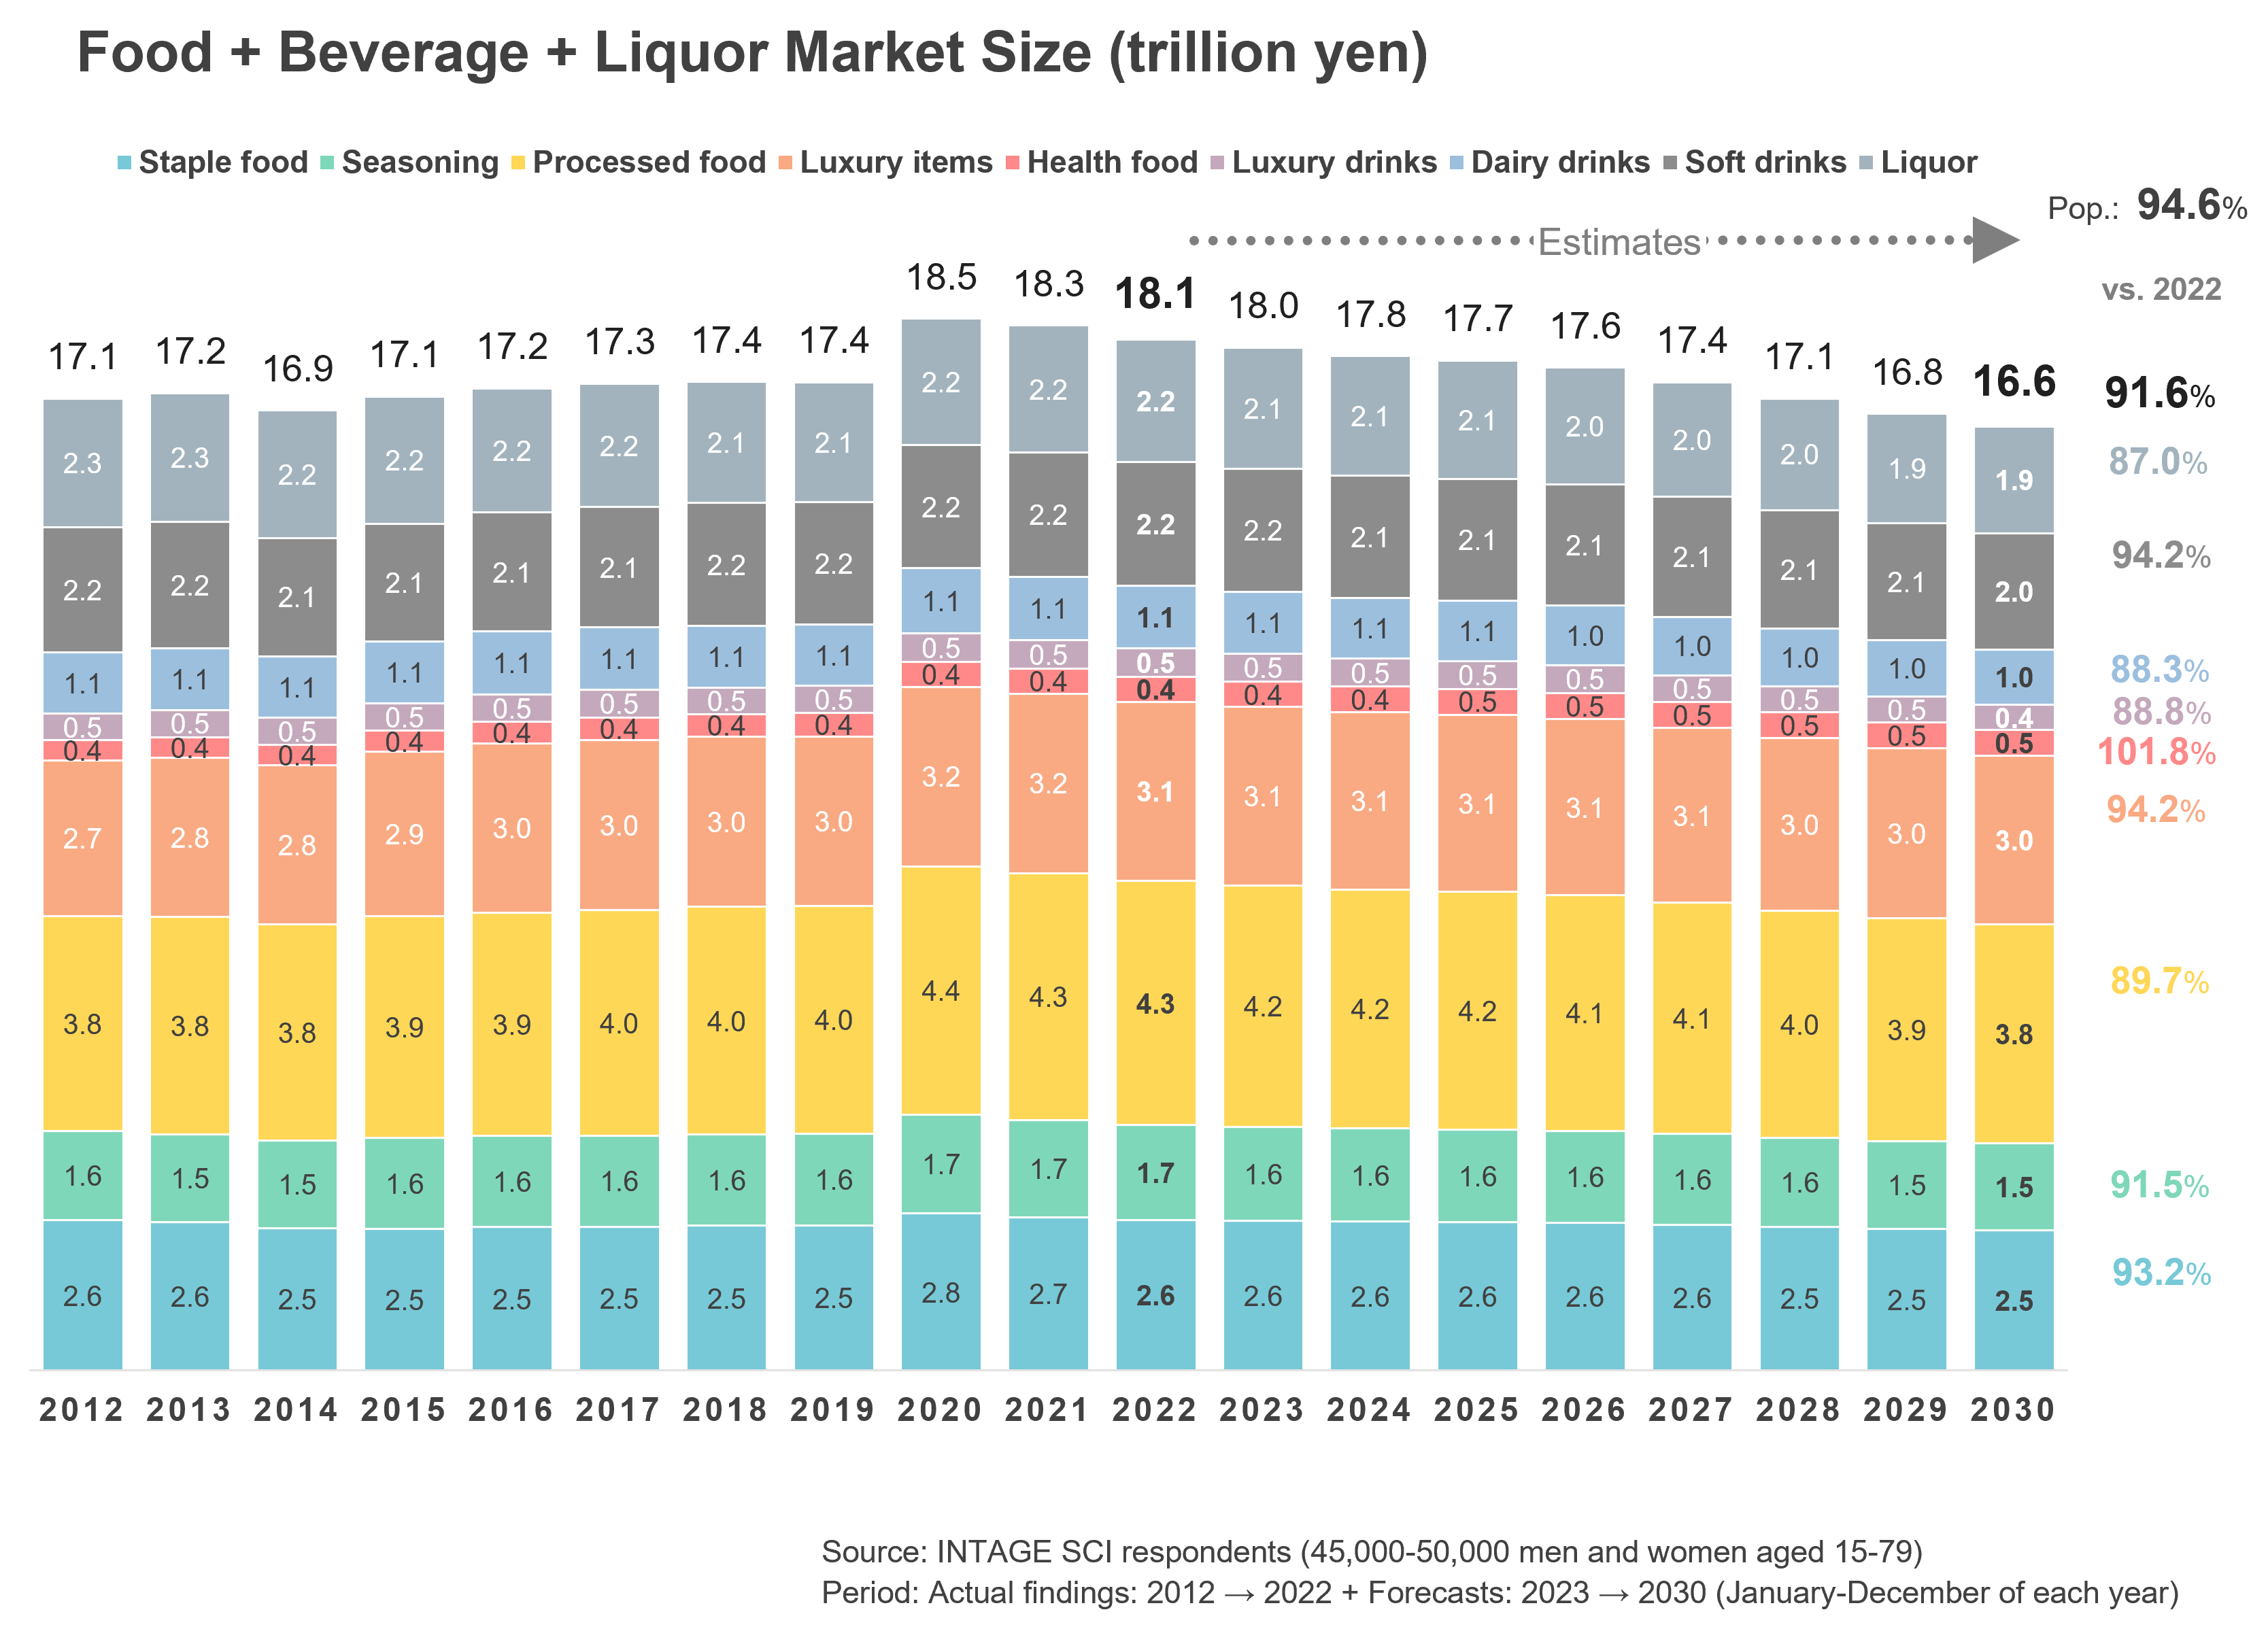
Next, let’s look at the projected market size in 2030 (Fig.2). What we found is not that the market will shrink by 5.4% in line with the population. Rather, the Food + Beverages + Liquor market will be 91.6% of the 2022 level – a decline of 8.4%!
Fig.2
The shrinkage of “Liquor”, “Dairy drinks”, and “Luxury drinks” is particularly significant. Conversely, the only category that is not affected much by the decline in population is “Health food”*2, which includes supplements. In addition, the shrinkage of “Soft drinks” and “Luxury items (sweets, nutritional balance foods, yogurt, ice cream, etc.)” is only on par with the shrinkage of the population.
What these trends suggest is that there is a headwind for categories related to “relaxing moments” at home (such as breakfast, tea time, and evening drinks) and a tailwind for categories related to “health”, “convenience/time-saving” (e.g., soft drinks that can be consumed immediately instead of beverages prepared by hand), and “snacking”.
What factors could cause these changes in market size? Before we explore the causes, let’s look at the forecasting approach used in this report.
Forecasting Approach for “Market Size in 2030”
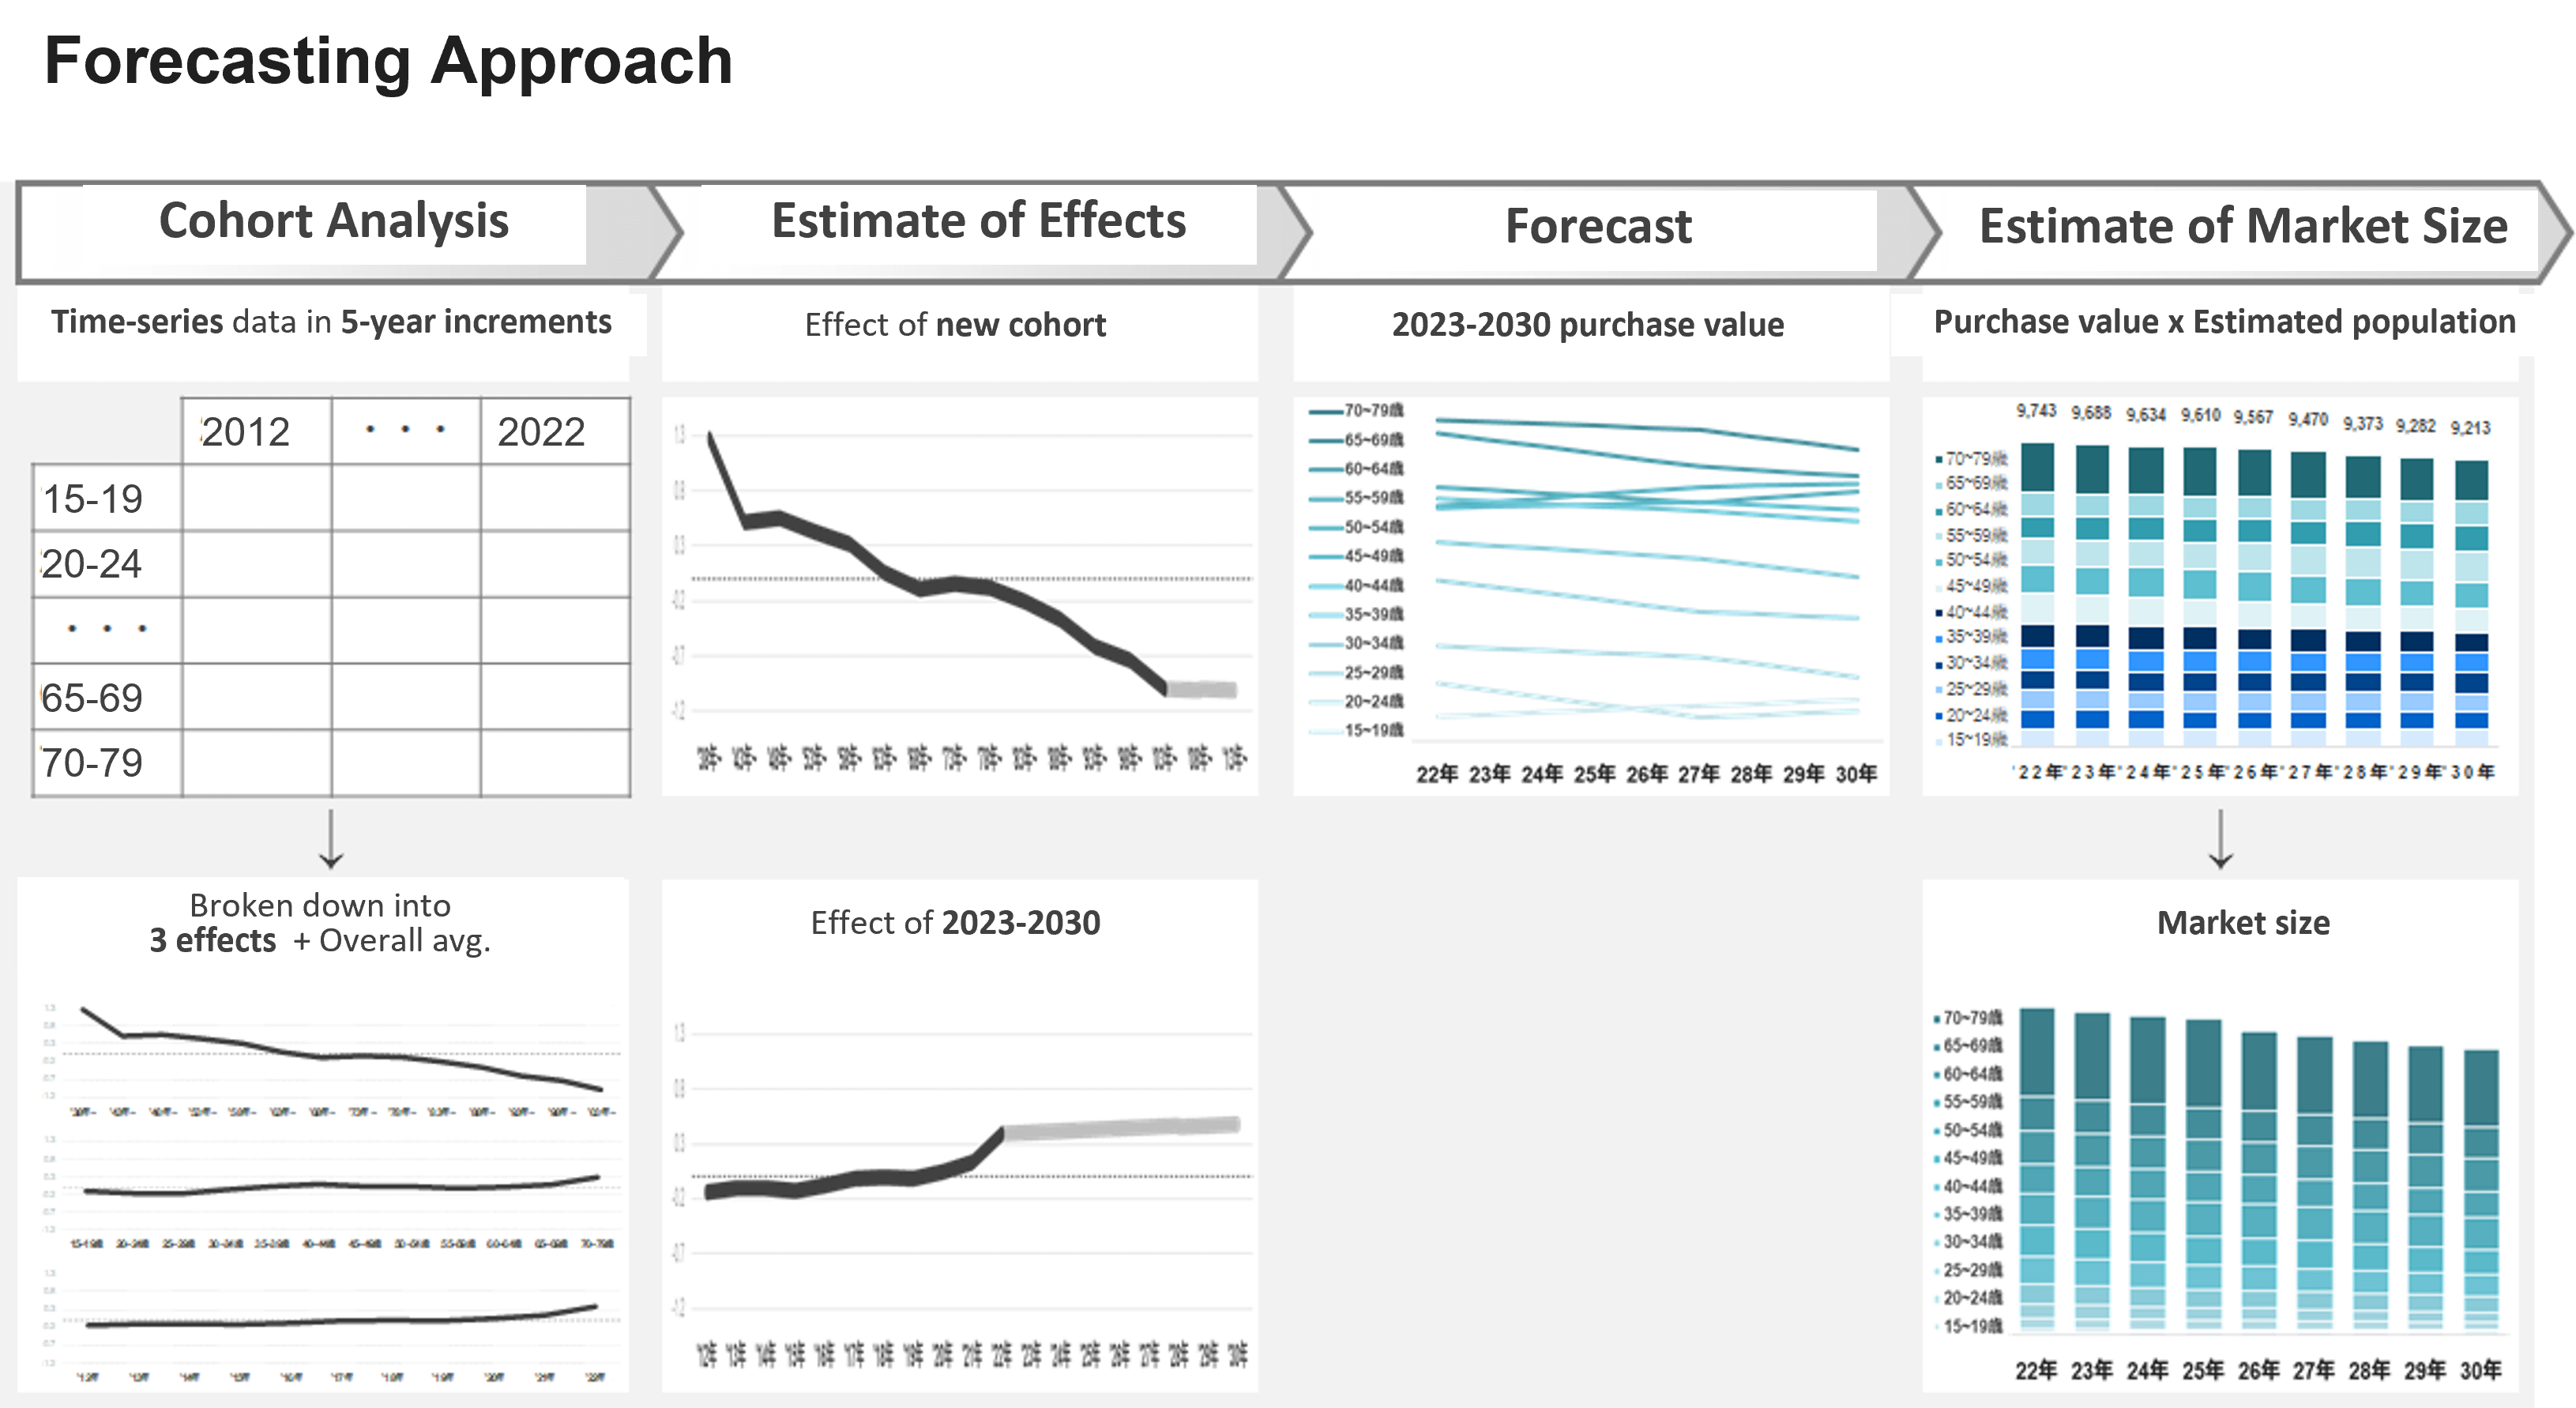
The 2030 market size data presented above is based on the four-step forecast shown in Fig.3.
Fig.3
Using cohort analysis, the purchase value in 5-year increments from 2012~2022 is broken down into “3 effects” – i.e., generation (“cohort”), aging, and period – and “overall average”. The effects of the “new cohort (born in 2008~15)” and “2023~30” are estimated. 3 effects for 2023~30 + Overall average = Projected purchase value Purchase value x Population = Estimated market size
There are various methods for market forecasting, but the reason why we adopted “cohort analysis” rather than growth rate multiplication, logarithmic approximation, time series analysis, or multiple regression analysis is that food and beverage preferences and cooking habits are greatly influenced by “cohort” (e.g., older segments cook with more seasoning combinations while younger segments incorporate more processed foods, etc.) and “aging” (e.g., people come to have favorite foods as they grow older, and grow unable to eat fatty foods, etc.), rather than by the “period”. We believe that for the Japanese market, whose demographic composition is changing dramatically due to the rapid aging of the population and declining birthrate, this is an appropriate forecasting approach.
What is “Cohort Analysis”?
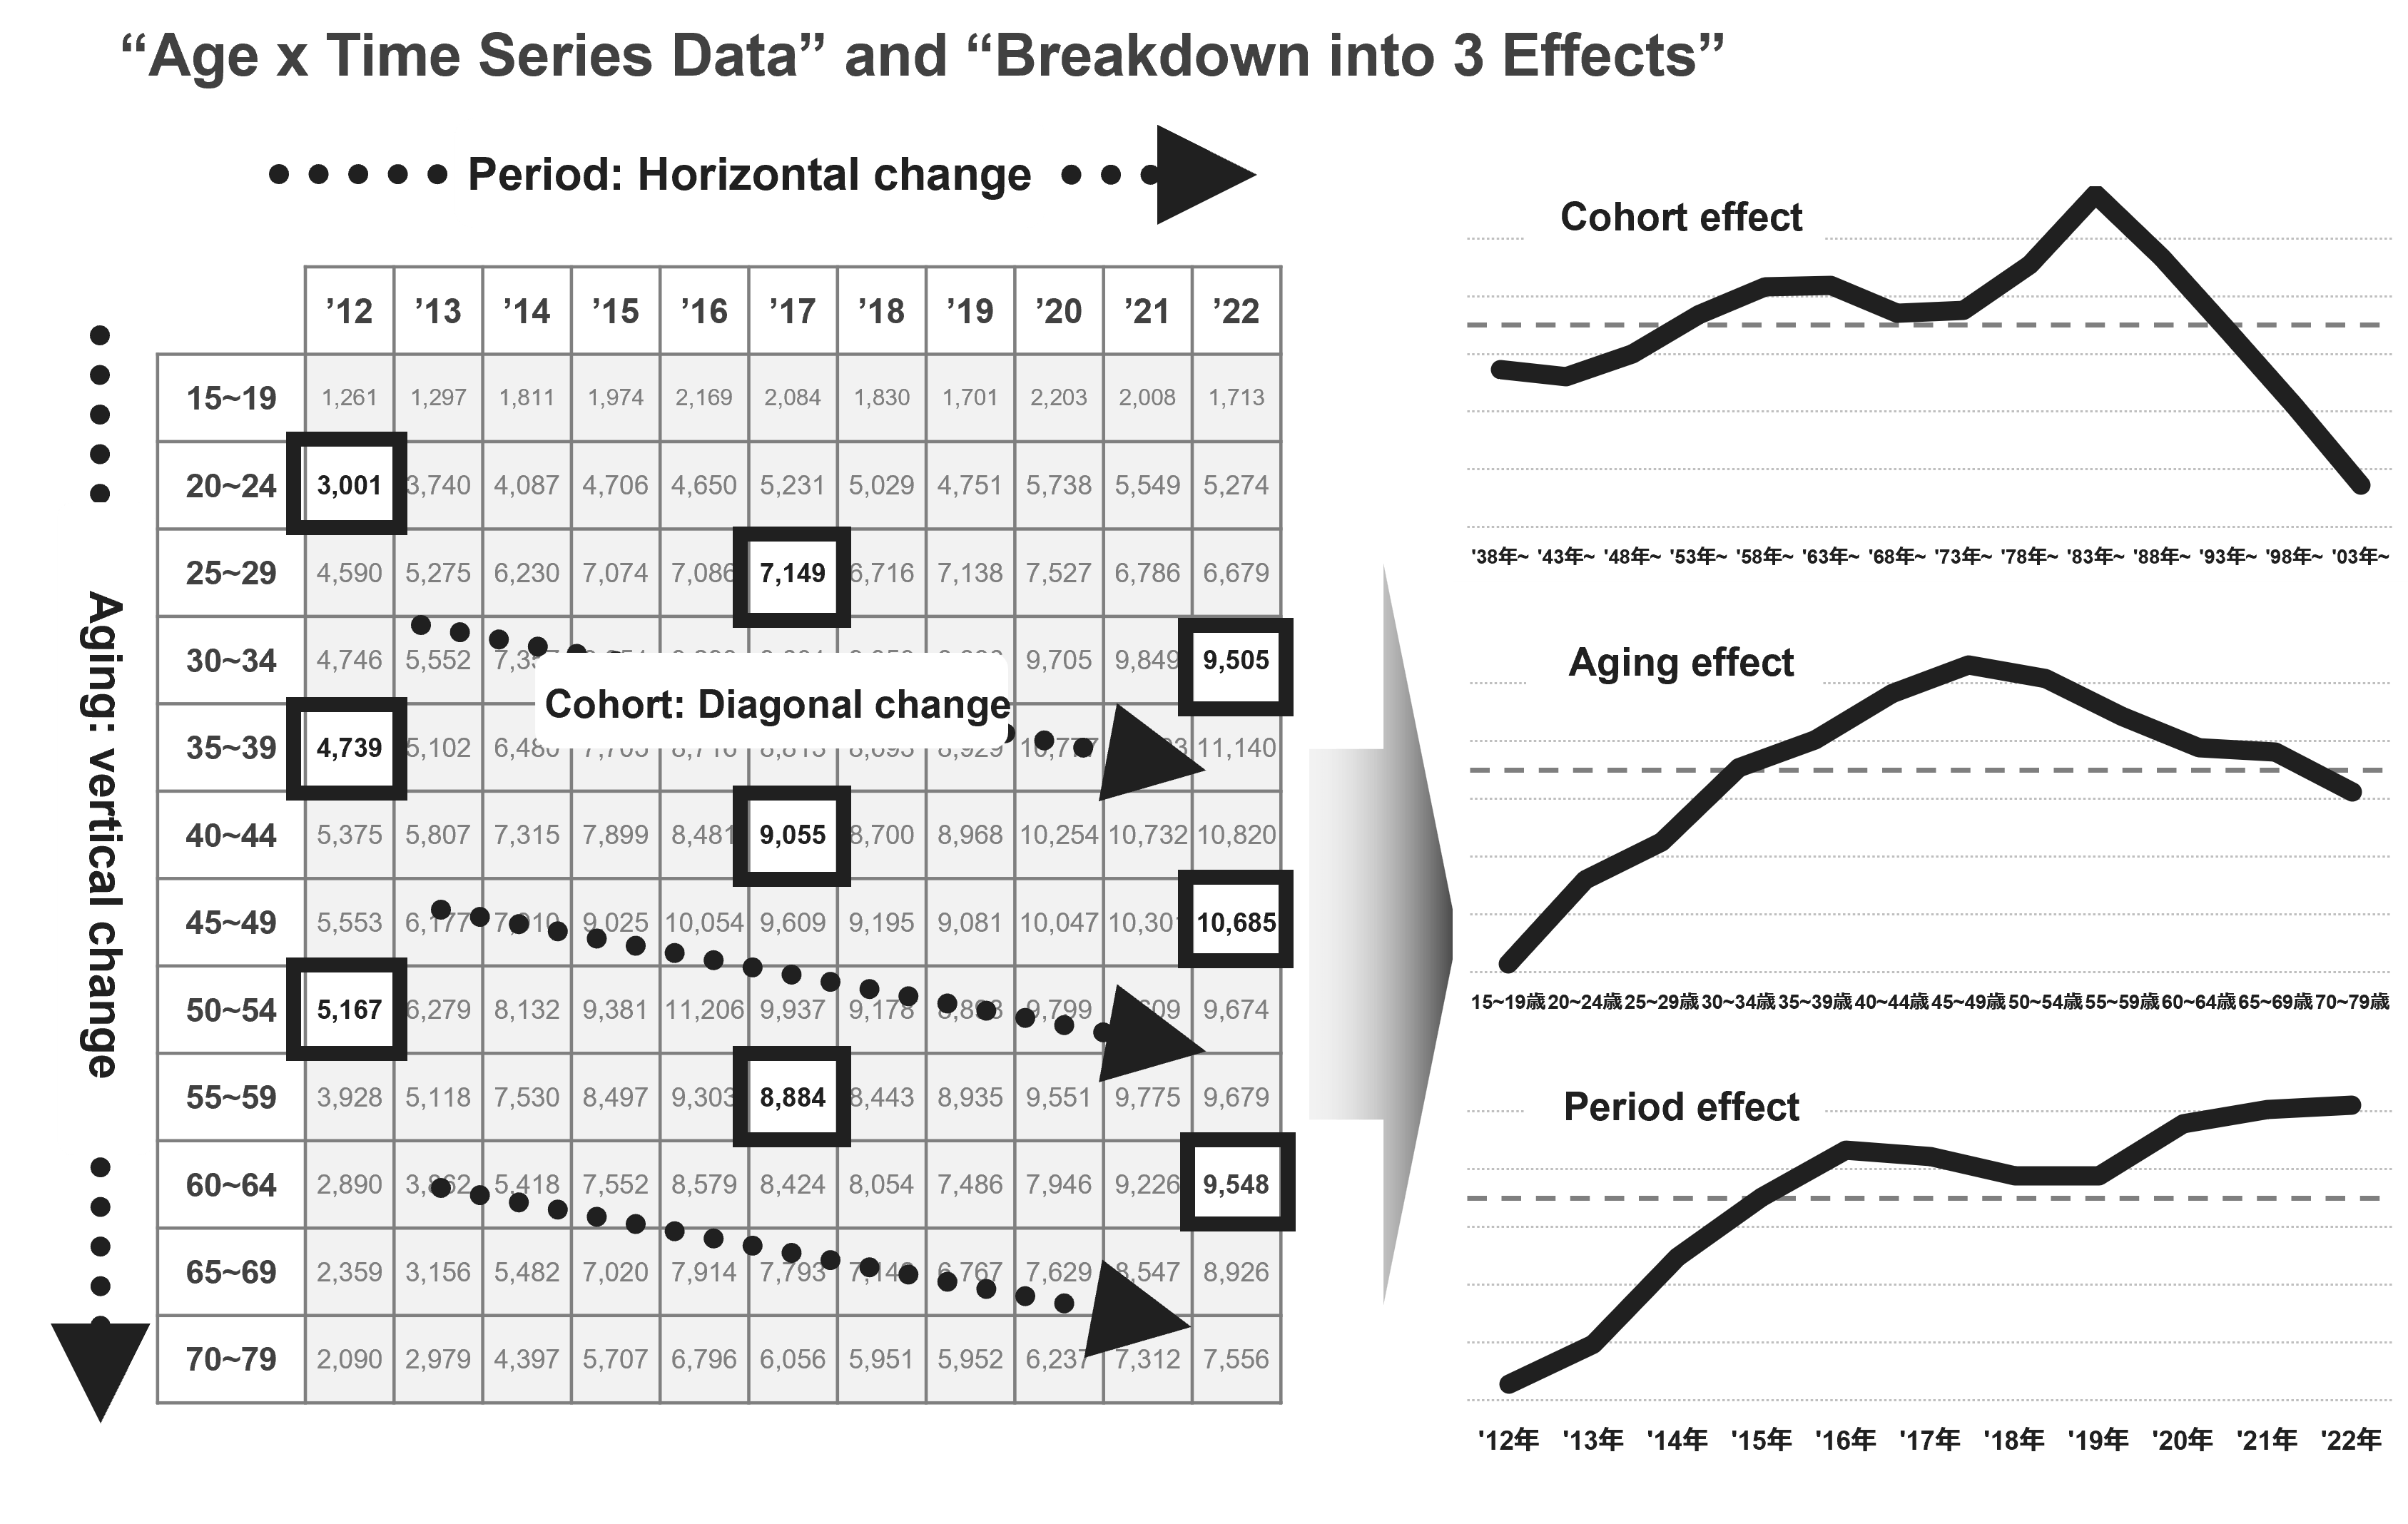
First, let’s briefly outline the characteristics of “cohort analysis”. For cohort analysis, “Age x Time series” data are prepared as shown in Fig.4. Since this analysis looks not only at the effects of aging (vertical axis) and the period (horizontal axis), but also includes the “generational” effect (diagonal trend), it is possible to understand the demand structure of the category in terms of three effects, giving us a deeper understanding than simple time series data by age.
Fig.4
Interpreting the “Market Size in 2030”
Next, let us try to gain a better understanding of our calculated market size for 2030 in light of various indicators of what is happening in the world. We looked at the data with Hiromasa Tanaka, director of INTAGE’s Consumer Research Center, which continues to explore social trends and lifestyle changes using a wide range of events and data.
(Review)
Hiromasa Tanaka, Consumer Research Center: With the revision of the standard for wearing masks in daily life and the decision to downgrade COVID-19 to Category 5 (“common infectious disease”) under the Infectious Disease Control Law in May, we are now approaching a major turning point in the pandemic. Until recently, customers would often ask me about what the world will be like after COVID, with “the new normal” as a key word, so I was very interested in the “picture of the future” that would emerge when using data. Various companies and institutions have attempted their own market forecasts, some of which I have seen myself, but my impression is that the approach of conducting analysis by defining the variables that produce future scenarios as “generational effect”, “aging effect”, and “period effect” is more suited for today’s unpredictable world.
Ikuo Tsuruta, Business Design Department, CBD Division: That’s right. One advantage is that the pandemic and the price hikes in 2020-22 can be extracted as “period effects”. In addition, macro-environmental factors that are important in forecasting markets such as government policy, the economy, technology diffusion, and environmental disasters, are highly uncertain and subject to wide fluctuations. Given the basic premise that the only thing we can be fairly certain about is demographics, market estimates based on population are simple yet valid. Furthermore, I also felt that when this fairly reliable population estimate is multiplied by estimates that combine the effects of “cohort” and “aging”, which are difficult to distinguish, the market size data thus obtained feels realistic. However, one thing to keep in mind with forecasts is that it is important to view them as “a reference for making decisions”, to be used as a premise for strategies and plans, rather than as something that may or may not come true.
This is a bit long, but to give you some background on how this forecast came into being, over the past five years, I have led a number of projects to support the construction and review of business portfolios, the formulation of long-term strategies for 2030, and the discovery of new business opportunities. In these projects and at turning points such as the early stages of the COVID-19 pandemic – for which I wrote an article in 2020 – there are situations where we have to take a bird’s-eye view and long-term perspective of events and changes, and the factors behind them, to see what is likely to happen in the future. As one step in this process, we conducted various segment estimates and market forecasts, but due to the overlap with COVID, it was difficult to make predictions that felt convincing.
To be more specific, supposing we use the latest data to conduct estimates, it is hard to believe that current trends would continue because the impact of COVID was so strong in 2020-21; and while 2022 has seen a gradual weakening of this impact, the market has not yet returned to pre-pandemic levels. In addition, given the characteristics of the Japanese people, it is hard to see them suddenly behave as they did before the pandemic. In order to make a forecast that takes such factors into account, we explored and tested approaches that “feel right” and do not extract the impact of the “period” and simply assume growth trends will continue in the same manner. As a result, I was reminded once again of the merits of this approach, which I myself have used for more than 700 categories altogether.
Tanaka: The fact that “Liquor” does not mirror the decline in the Japanese population but shows a larger decline, for example, seems more realistic if factors such as “cohort” and “aging” are taken into account.
Tsuruta: With “Liquor”, if we consider the “aging” factor, as people who like to drink alcohol get older, we are likely to see a decrease in the number of drinks consumed and the amount consumed per drink.
Tanaka: Furthermore, if we consider the “cohort” factor, I can imagine that young people, who are not in the habit of drinking at home, might shift away from alcohol and toward low-alcohol drinks. Would you say that a similar reading of “Food” is valid?
Tsuruta: Absolutely. As people get older, they eat less and eat less, so the amount consumed per meal may decrease, and the number of meals per day may decrease from three to two times. Also, people living alone in particular are shifting from cooking to eating simple meals that do not require preparation and cleanup, satisfying their hunger with boxed lunches, deli dishes, and snacks such as pastries and yogurt, so the distinctions between meals and snacks are becoming more blurred.
Tanaka: Similarly, if we look at today’s busy working parents, we see that the use of ingredients and dishes that are convenient and time-saving are very popular. Separating out the elements that shape the future opens up a wider range of marketing approaches.
Tsuruta: As the figures in the forecast show, we believe that the health food and “Foods with Functional Claims” markets will continue to grow. If, in addition to the elements of “cohort”, “age”, and “period”, we also look at the data in terms of other events and background factors, we can gain insight into the overall theme of “health” and find clues to what marketing approach we should take.
For example, the following kinds of opportunities suggest themselves. ・Working out on a daily basis is becoming popular and protein products are performing well. Opportunity: “Beauty Enhancement” for young people, who have fewer physical problems but want to improve their appearance, and want to be both healthier and better-looking, even if it takes a little time and effort. ・Food with Functional Claims and malt beverages are performing well. Opportunity: “Health Maintenance and Prevention” for middle-aged people, who are experiencing a decline in physical fitness and changes in their physique, and who want to avoid illness and maintain their physical condition through daily eating and drinking without too much strain. ・Supplements are still going strong. Opportunity: “Improvement” for the elderly, who are increasingly prone to specific issues in addition to general problems, and want to get closer to their original condition, even if they have to spend a little more money.
Tanaka: I see. I really get a strong sense of thinking from and understanding consumers’ point of view, focusing not on “offering more products because it is a growing market”, but rather on “what products need to be delivered to which people”.
Tsuruta: In addition, we believe it is important to look at the food and beverage category in “five-year age increments” in order to raise the “resolution” of consumer understanding. Since changes in life stages (schooling, employment, marriage, childbirth, childrearing, child independence, retirement, etc.) occur around midway through each age segment, resulting in major changes in lifestyle and consumption, it seems likely that the eating and drinking habits at the first half of each age segment would differ from those in the latter half.
Tanaka: This is one of the strengths of having a consumer panel and being able to collect data continuously from the same panelists. I am looking forward to your next market forecast report, which will focus on categories where you have made some interesting findings.
Tsuruta: Thank you, I hope you enjoy it.
With our “cohort analysis” of the 156 Food + Beverage + Liquor categories that we worked on for this report, we found supporting evidence for a variety of changes. For the next installment, we will select a few topics of interest from these findings to gain insight into current trends.
*1SCI® (Nationwide Consumer Panel Survey) Data collected from 50,000 men and women aged 15~79 nationwide on their purchases of consumer goods to which JAN codes are assigned.
*2 Health food: Since this only covers products with a JAN code, the capture rate is about 40% of the total market, including products without a JAN code.
Author profile
Ikuo Tsuruta, Top Analysis Designer, Business Design Department, Customer Business Drive Headquarters, Intage Inc.
Since joining Intage Inc., he has been responsible for developing solutions and analysis menus in all areas of research and analysis, including panel, ad hoc, data science, and consulting. In addition, he has been involved in project-based marketing support and analysis for a wide range of industries and over 150 companies.
Since joining Intage Inc., he has been responsible for developing solutions and analysis menus in all areas of research and analysis, including panel, ad hoc, data science, and consulting. In addition, he has been involved in project-based marketing support and analysis for a wide range of industries and over 150 companies.
Reproduction and Quotation
◆This report is copyrighted by INTAGE Inc. Please check the following prohibitions and precautions, and specify the source when reproducing or quoting this report. “Source: INTAGE “Knowledge Gallery” article published MM/DD/YYYY article”
◆The following are prohibited: ・Alteration of this article in full or in part ・Sale or publication of this article in full or in part ・Uses that are against public order and morality, and uses connected with illegal activities ・Reproducing or quoting panel data* for the purpose of advertising or promoting companies, products, or services *Panel data include: SRI+, SCI, SLI, Kitchen Diary, Car-kit, MAT-kit, Media Gauge, i-SSP, etc.
◆Other precautions: ・INTAGE Inc. shall not be liable for any trouble, loss, or damage caused by the use of this report ・These usage rules do not restrict the use of quotations or other uses permitted under the Copyright Act of Japan
◆For inquiries about reproduction and quotation, click here.