Approaches to Pricing, with Example Price Survey Questions and Analysis Methods
In pricing a product or service, if you set the price too high, the profit margin will be large but it will be difficult to sell many units. On the other hand, if you set the price too low, you might sell a lot but the profit margin will be small and you will not make much of a profit. Between these “too high” and “too low” price points, there seems to be an “optimal price” at which profit is maximized. A price survey that asks consumers about the value and price of a product or service is effective in determining the optimal price.
This article will first introduce approaches to pricing, then it will provide examples of price survey questions and analysis methods that can be used in pricing.
Pricing is determined based on three perspectives: cost, customer value, and competition. Each is explained below.
① Methods of Pricing based on Cost
These methods involve setting the price by adding a certain profit to the cost. One of these methods is “cost-plus pricing.” This is a way to set the price by adding profit to the actual cost incurred.
② Methods of Pricing based on Customer Value
These pricing methods are based on how much value the buyer (consumer) sees in the product or service (perceived value) rather than the seller’s cost.
One such method is “perceived value pricing.” This involves first conducting a questionnaire-based survey to ascertain the perceived value of the product or service to consumers. The results of this survey are then used to reveal the “sellable price range,” set a target price, and determine the specifications of the product or service that would enable profits to be made at that price.
③ Methods of Pricing based on Competition
These methods set prices with competition from rival firms in mind. In cases where the value of your company’s product is equal to that of your competitor’s product, if your competitor sets a lower price, your company must follow suit and lower the price or you will lose customers. “Practical pricing” is a pricing method that fully takes into account the actual prices (market prices) of products or services sold by competitors.
Alignment of Pricing and Marketing Strategies
Pricing needs to be consistent with your marketing strategy. A marketing strategy entails segmenting the market and determining the target customers. One then creates a plan for the “four P” elements of marketing (Product, Price, Place (distribution), and Promotion) according to the target customers. Pricing is not determined in isolation, but in alignment with the other three factors.
If your target customer base is more concerned with quality than price, they will not necessarily prefer a low price, but will buy when you offer high quality at a reasonable price. Also, if your target customers value on-the-spot availability more than quality, they will pay a high price even if the quality is at the minimum standard. In this way, you can make a large profit by pricing according to the value your target customers perceive.
Example Price Survey Questions and Analysis Methods
Among the above three perspectives, price surveys are useful when considering pricing based on customer value and competition.
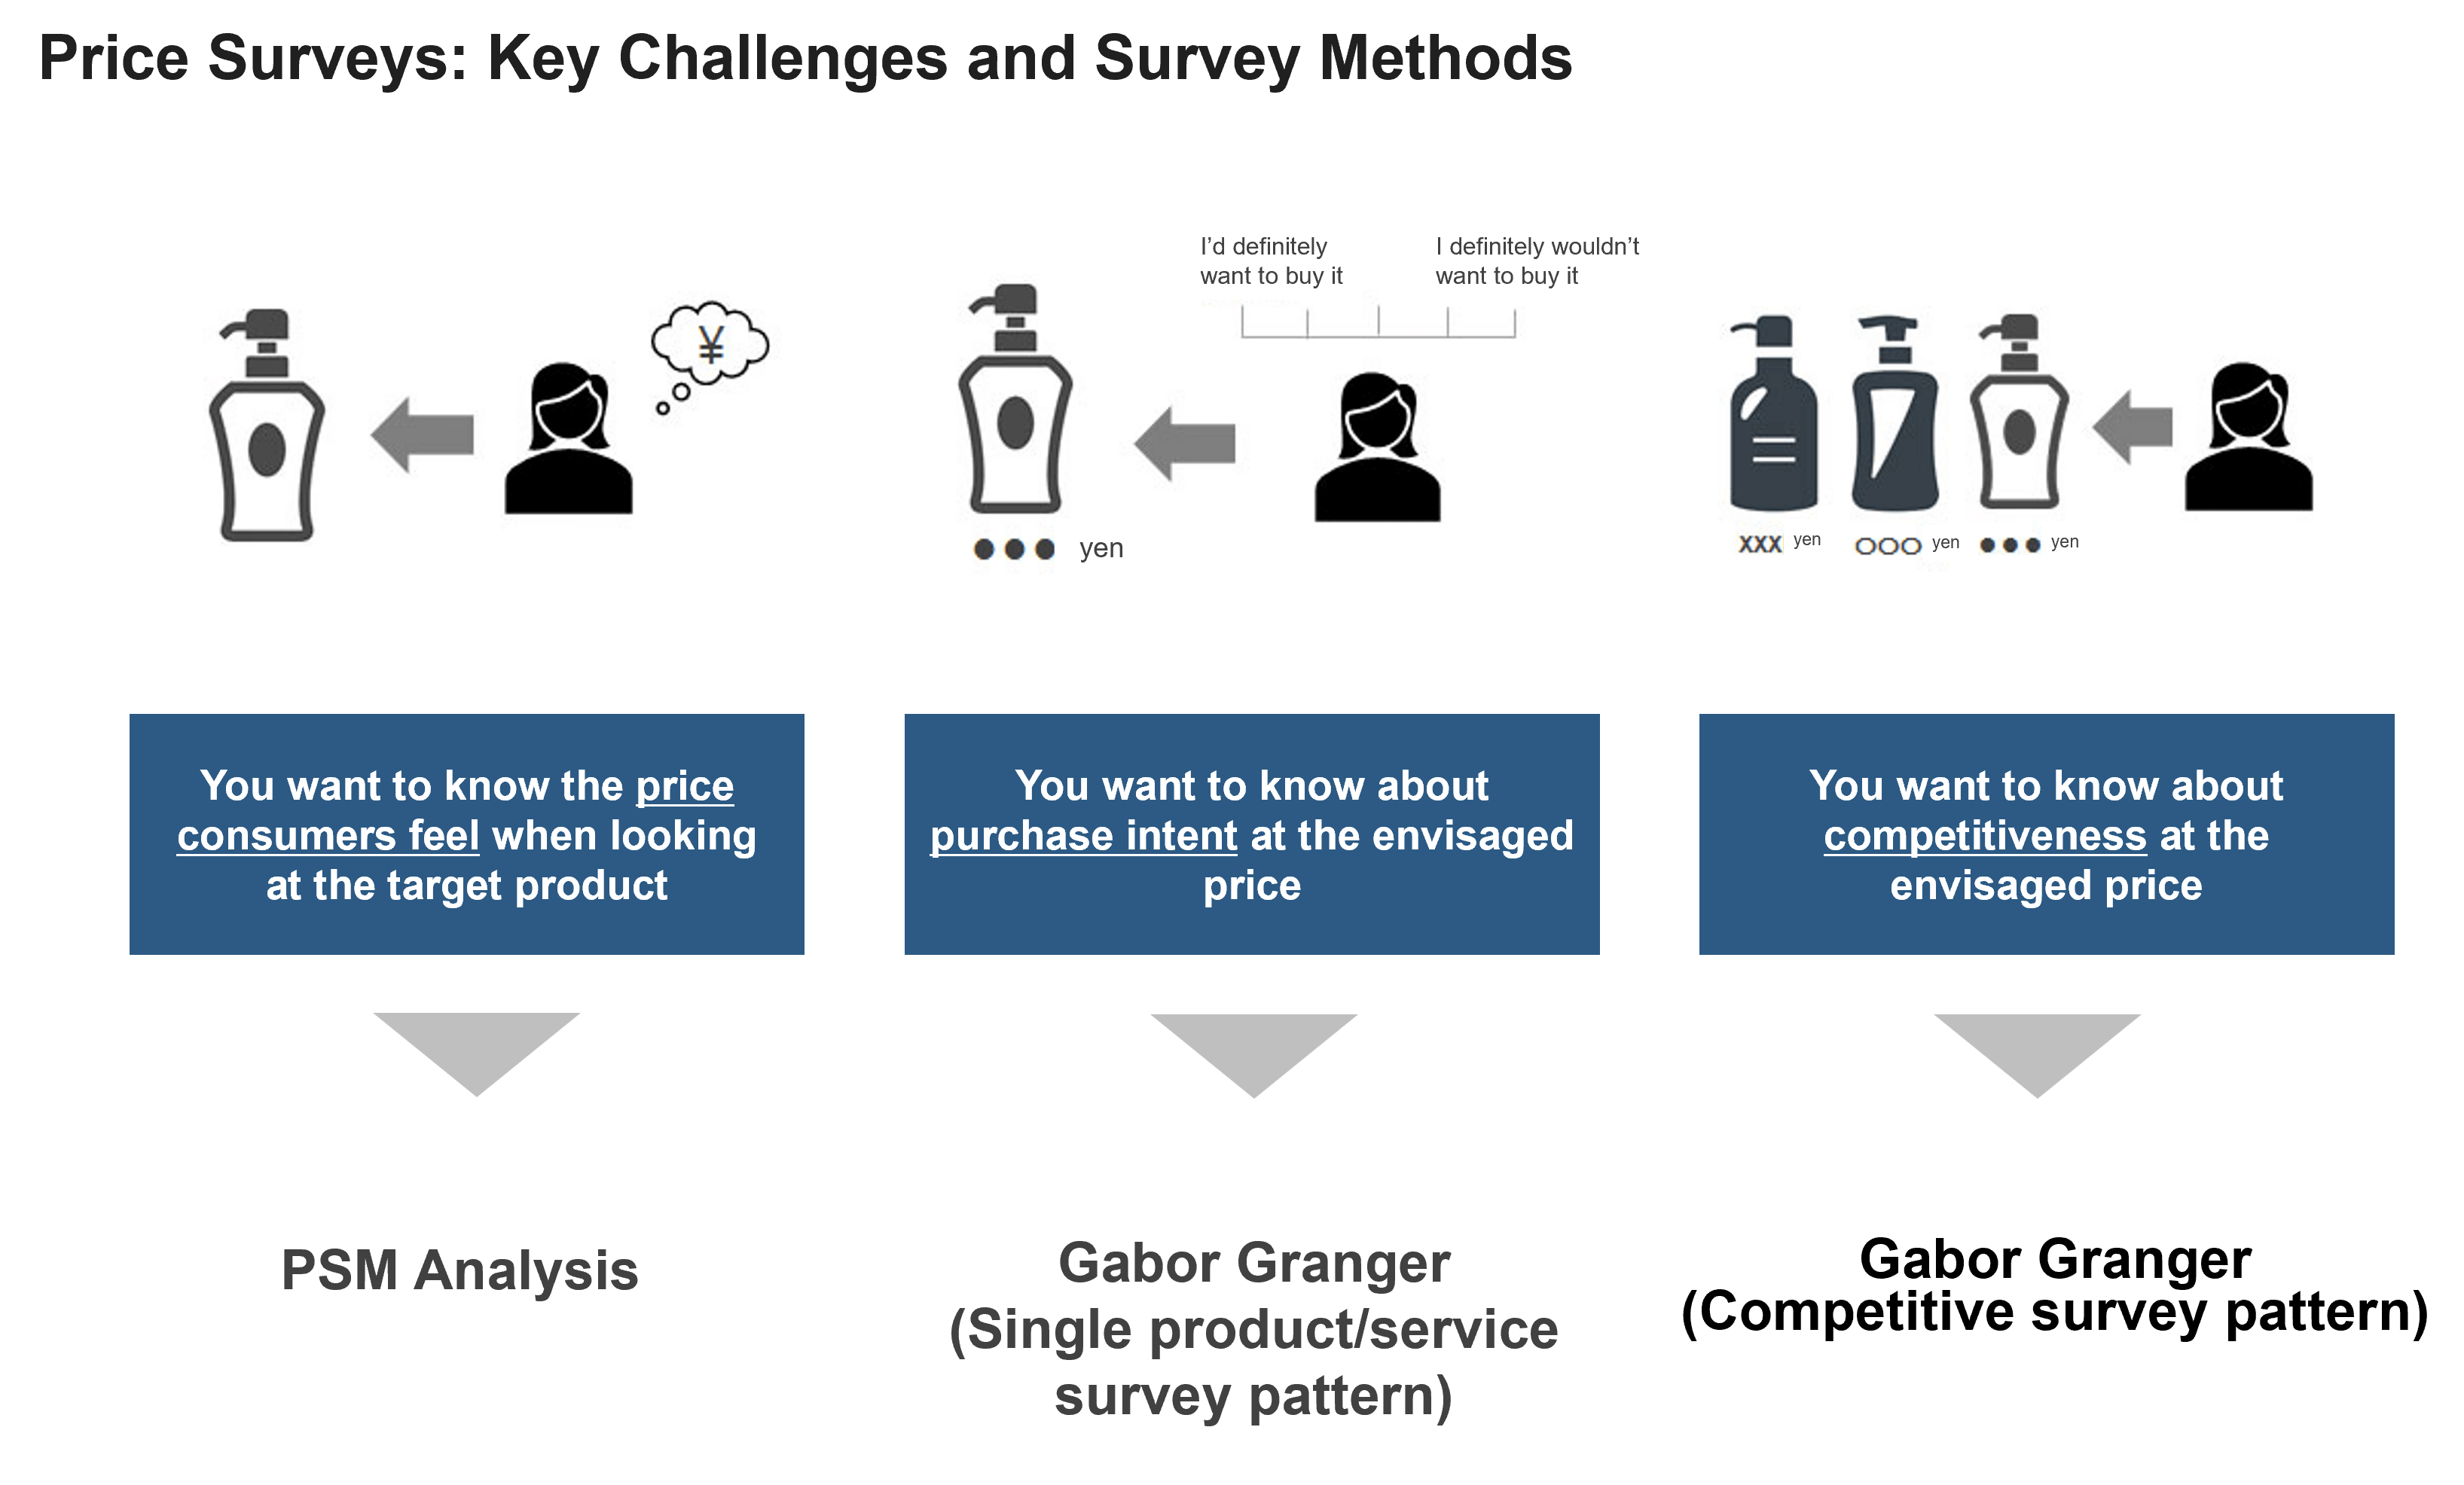
Examples of questions and analysis methods that address the key challenges in price surveys are presented in order below by survey type.
This method asks consumers about their sense of price for a product or service.
Specifically, this entails presenting images and descriptions of the product or service and asking survey participants to answer the following four questions directly:
At what price does it start to feel expensive?
At what price does it start to feel cheap?
At what price does it start to feel too expensive to buy?
At what price would you start worrying about the quality because it is too cheap?
Based on the price information in their memory, consumers imagine the price they think is appropriate for the product or service presented, and they respond with the prices they feel are high, low, too high, and too low according to that price standard.
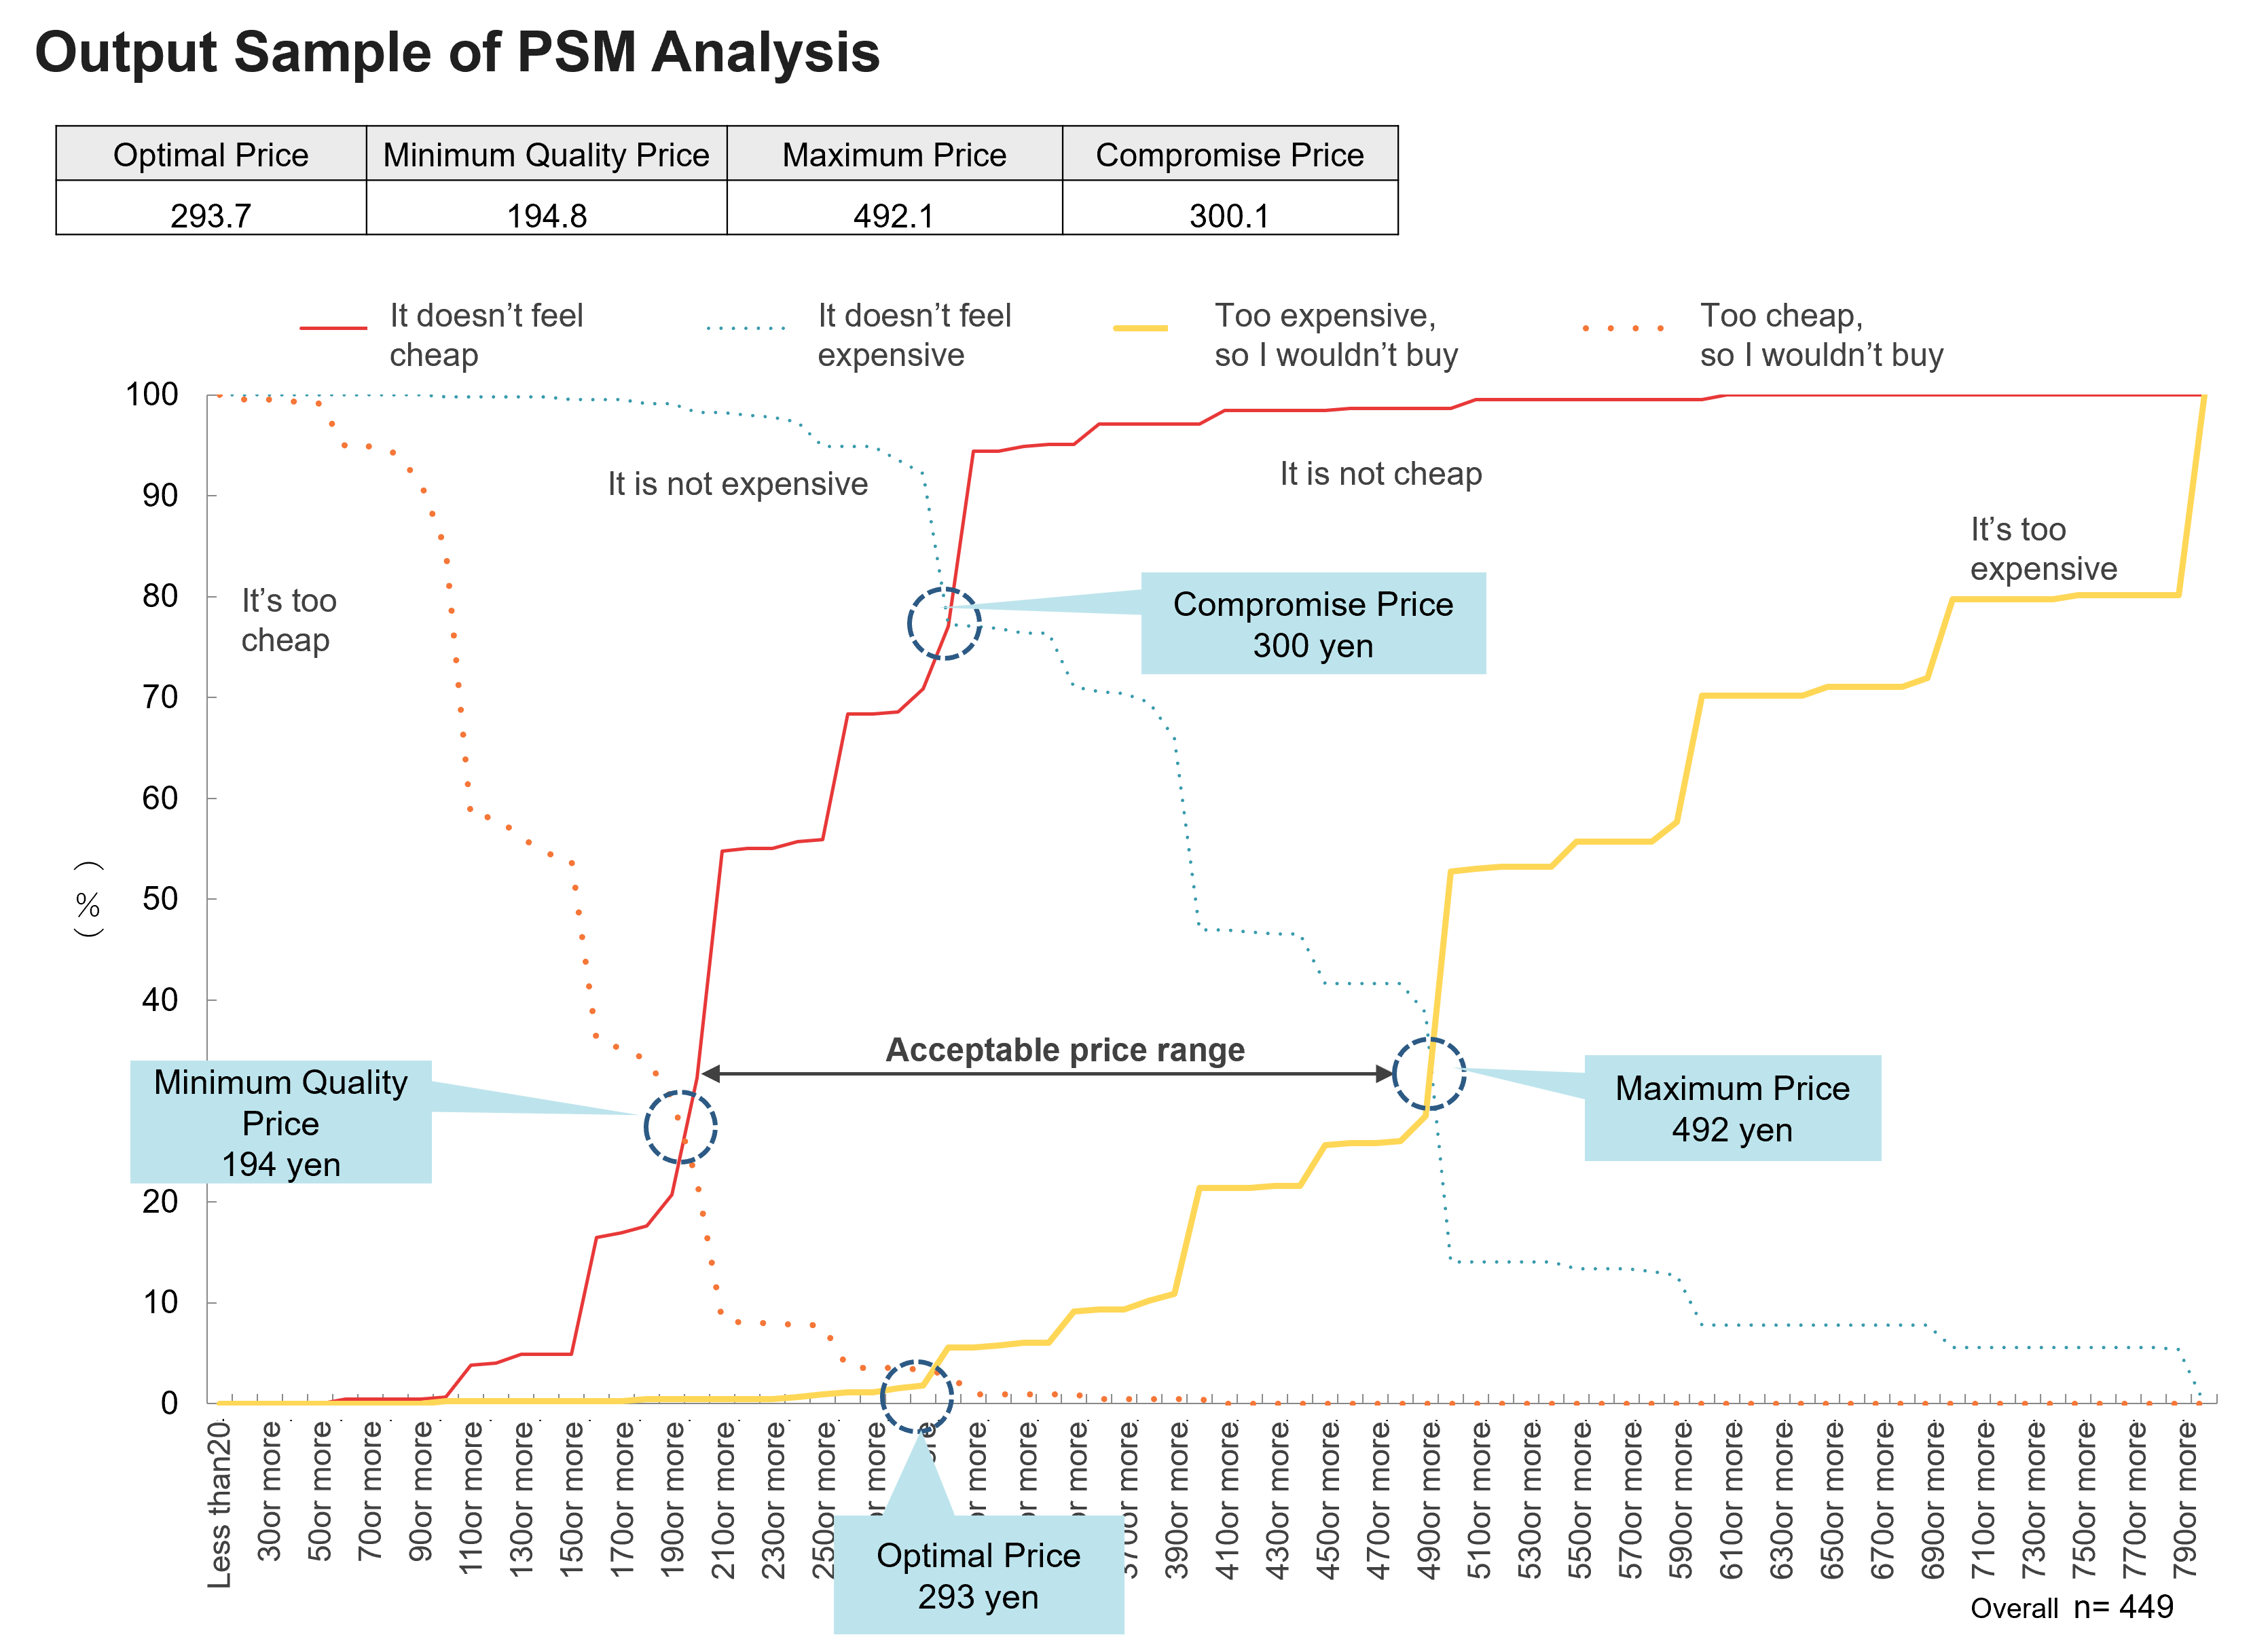
Responses obtained in this way are used to create the graph shown in Fig.1 (This graphical analysis method is called PSM analysis.).
Fig.1
The horizontal axis shows the price of the product or service presented, and the vertical axis shows the percentage of people who feel it is “too cheap,” “too expensive,” “not expensive,” and “not cheap” in relation to the price, with each expressed as curves. The analysis involves finding the intersections of the four curves and considering the price within that range, balanced with the profit.
The intersections of the curves are interpreted as follows: ●Minimum quality price (194 yen): The price at which the percentages of “people who wouldn’t buy it because it is too cheap” and “people who do not feel it is cheap” are minimized. In other words, it represents the price at which the percentage of “people who feel it is cheap” is maximized. If the price is lower than this, the percentage of “people who feel it is cheap” will decrease, and the percentage of “people who wouldn’t buy it because it is too cheap” will increase, so such a price should arguably not be chosen.
●Optimal price (293 yen): The price at which the percentages of “people who wouldn’t buy it because it is too cheap” and “people who wouldn’t buy it because it is too expensive” are minimized (the price at which the percentage of people who wouldn’t buy is minimized). In other words, it represents the price at which the maximum percentage of people would buy, thus it can be said to be the optimal price.
●Compromise price (300 yen): The price at which the percentages of “people who don’t feel it is cheap” and “people who don’t feel it is expensive” are maximized. In other words, it represents that price that maximizes the percentage of “people who feel it is neither cheap nor expensive,” and therefore it can be said to be a reasonable price.
●Maximum price (492 yen): The price at which the percentages of “people who wouldn’t buy it because it is too expensive” and “people who don’t feel it is expensive” are minimized. In other words, it represents a price at which the percentage of “people who feel it is expensive” is maximized. If the price is higher than this, the percentage of “people who feel it is expensive” will decrease and the percentage of “people who wouldn’t buy it because it is too expensive” will increase, so it is arguably better not to choose such a price.
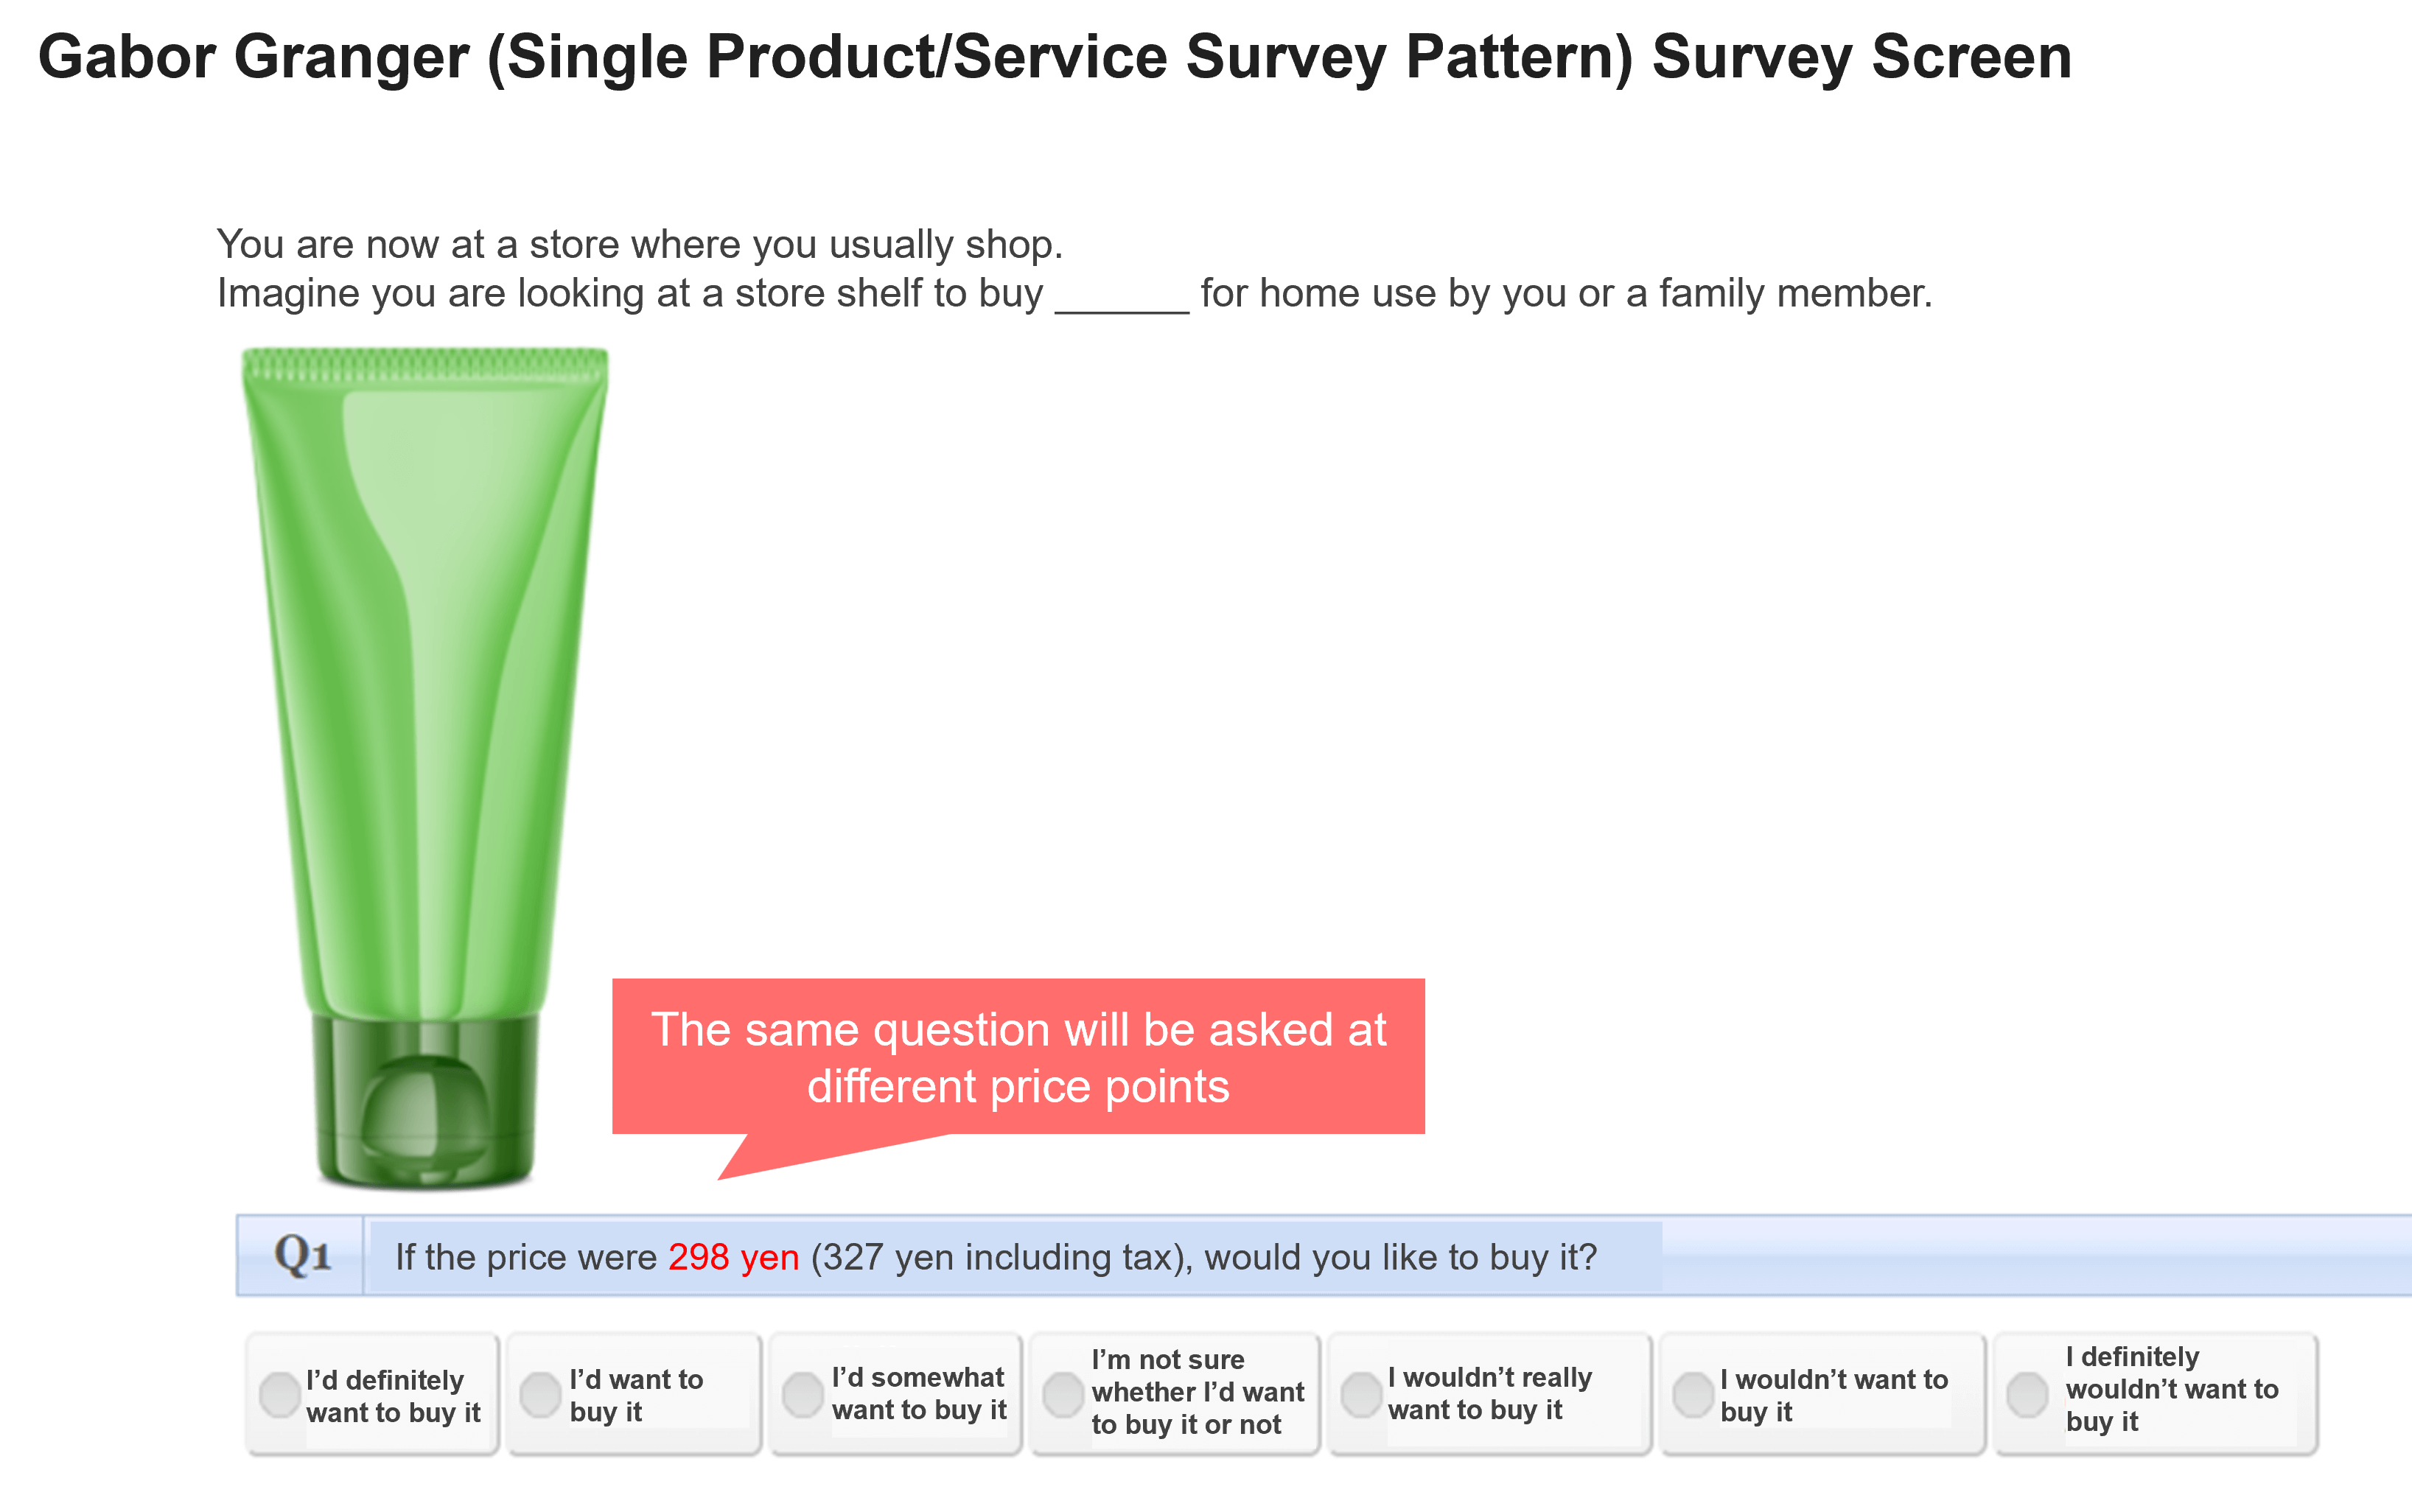
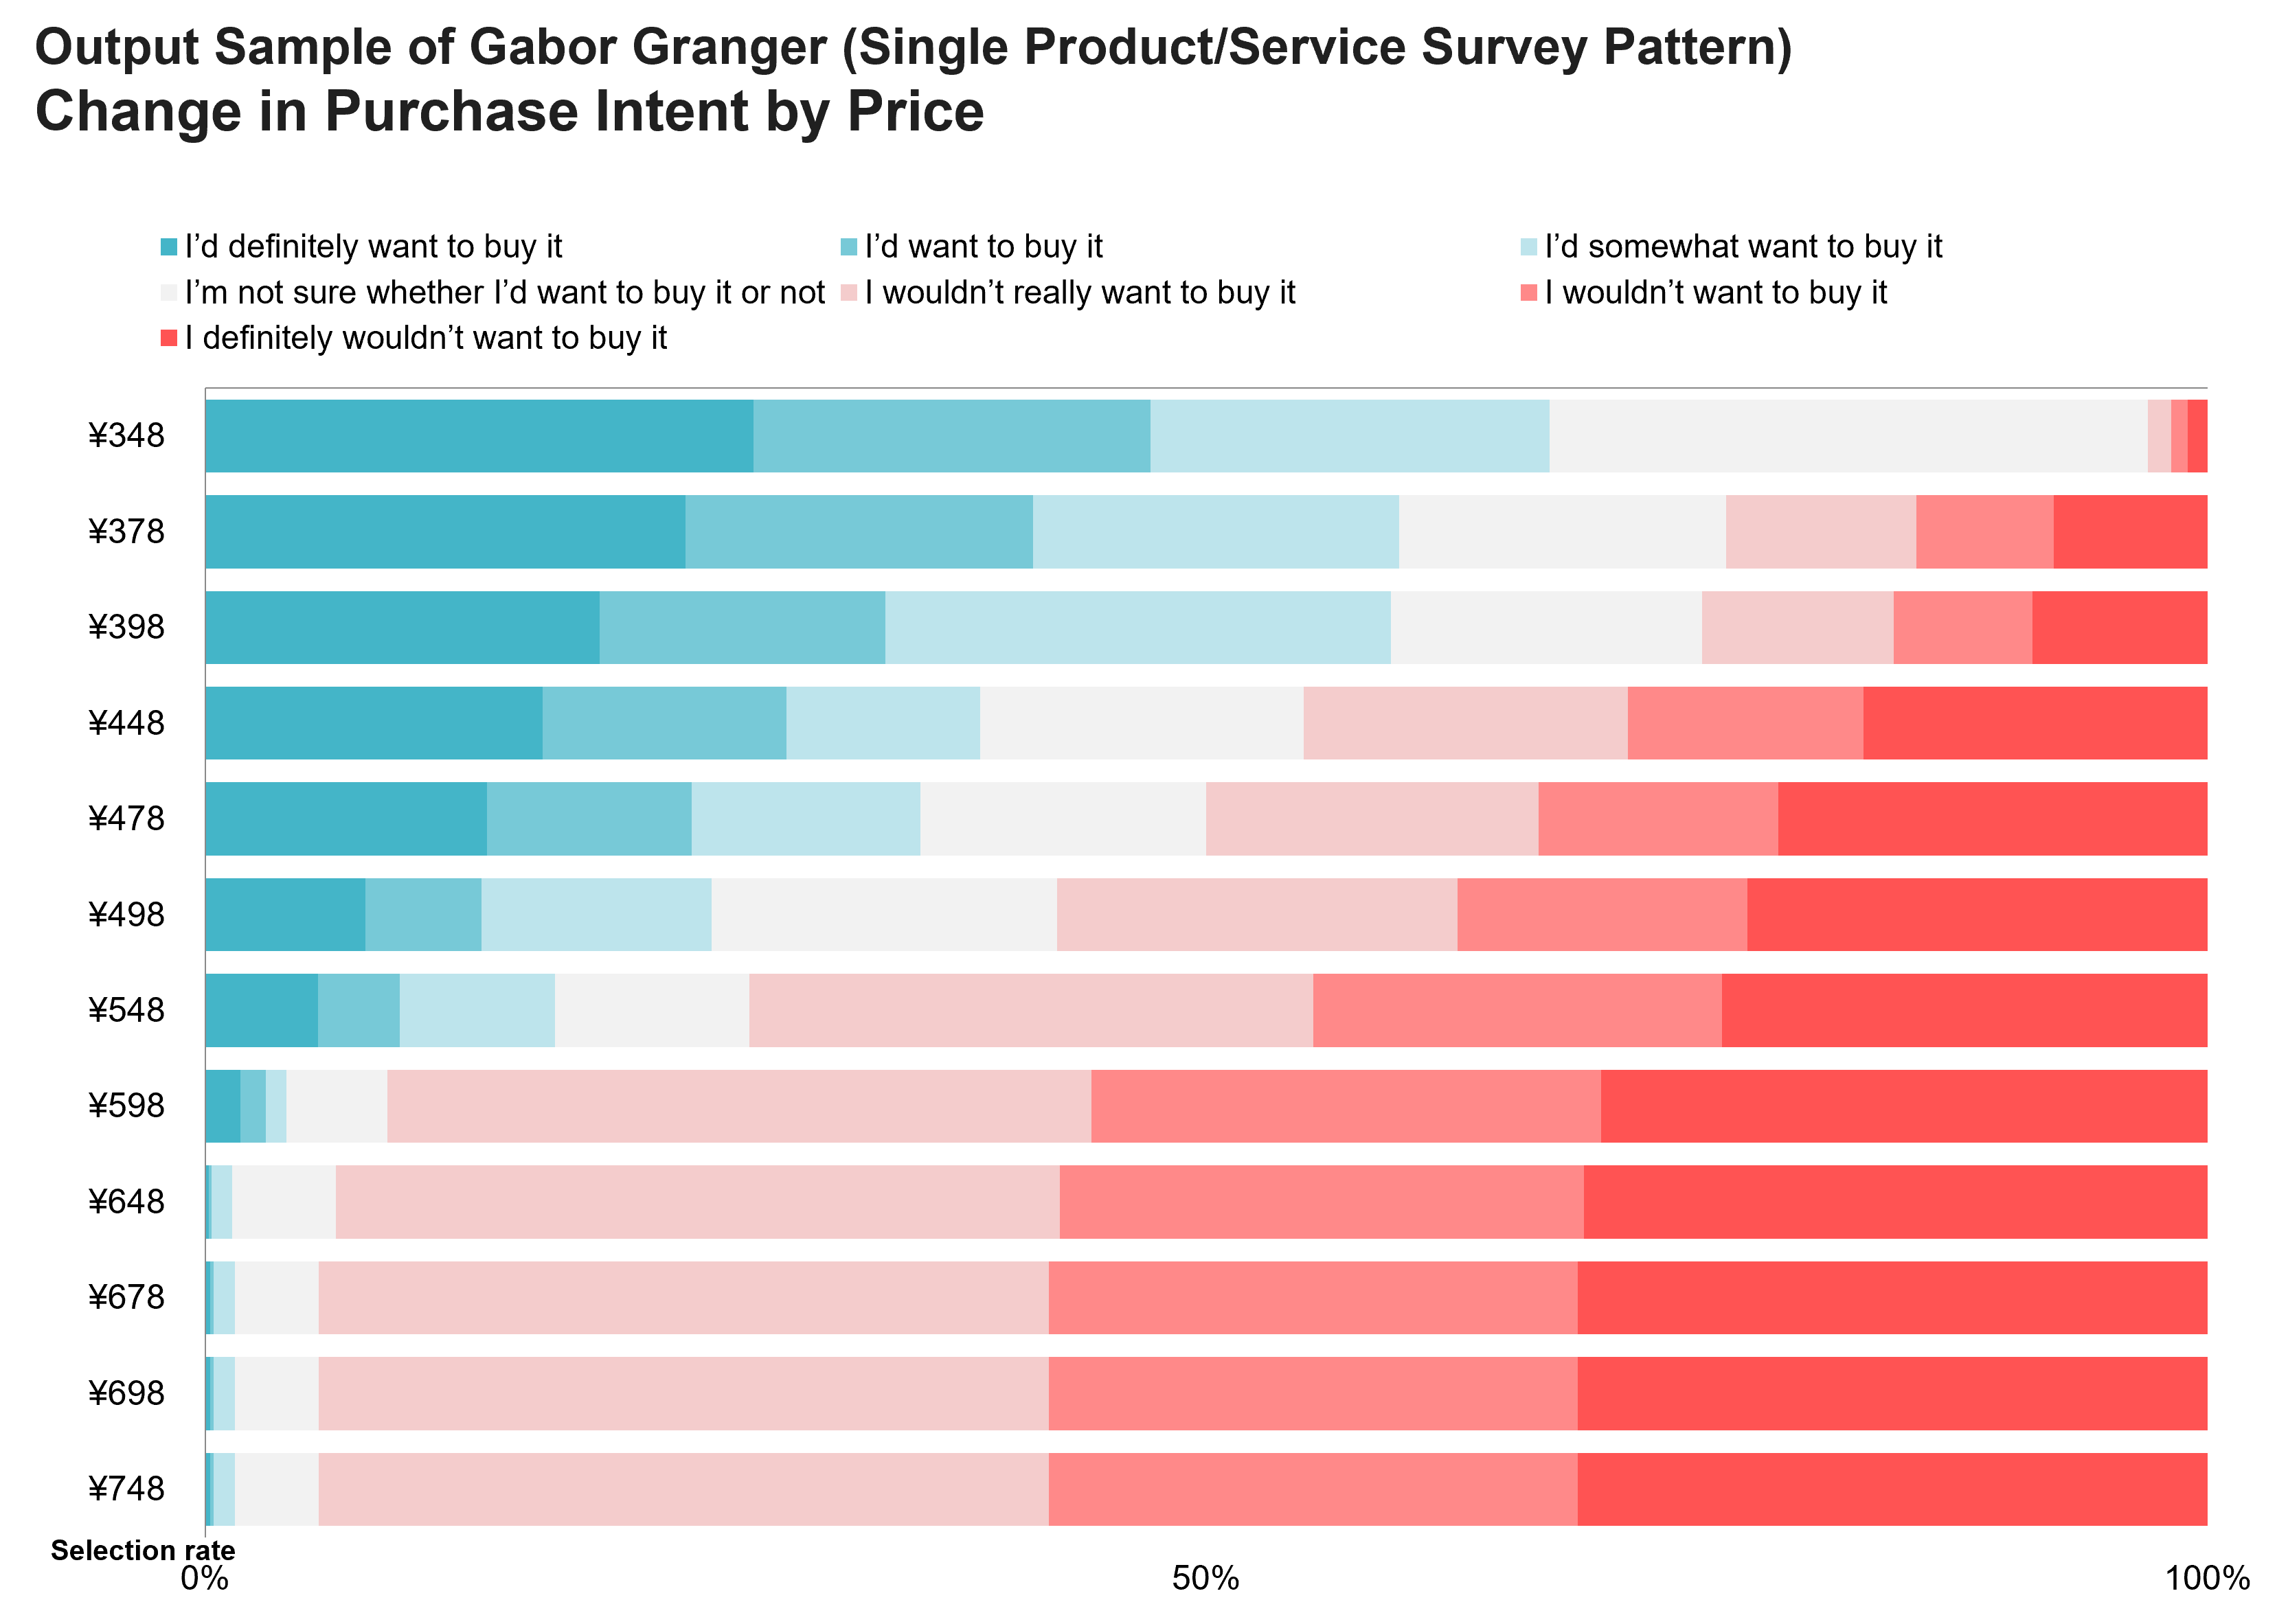
This is a method of asking about purchase intent by presenting prices along with goods and services. By adjusting the price and repeating the questions, this method captures how purchase intent changes as the price changes.
In this example, a screen similar to that shown in the figure below is used to perform the survey.
The answers obtained from this question are represented graphically as shown in Fig.2. The graph reveals how purchase intent changes as the price changes.
We can see that the “total desire to purchase” percentage, which is the sum of the three percentages of “definitely want to buy,” “want to buy,” and “somewhat want to buy,” decreases as the price increases. The size of this “total desire to purchase” percentage gauges whether marketing goals are likely to be met by looking at how much purchase intent there would be at which price points. It is important to note that the “total desire to purchase” percentage does not represent the percentage of people who will actually buy the product or service, because not all people who want to buy it will buy it. In fact there are hurdles to reaching a purchase, such as whether the customer is aware of the product or service and whether it can be purchased at a nearby store.
Fig.2
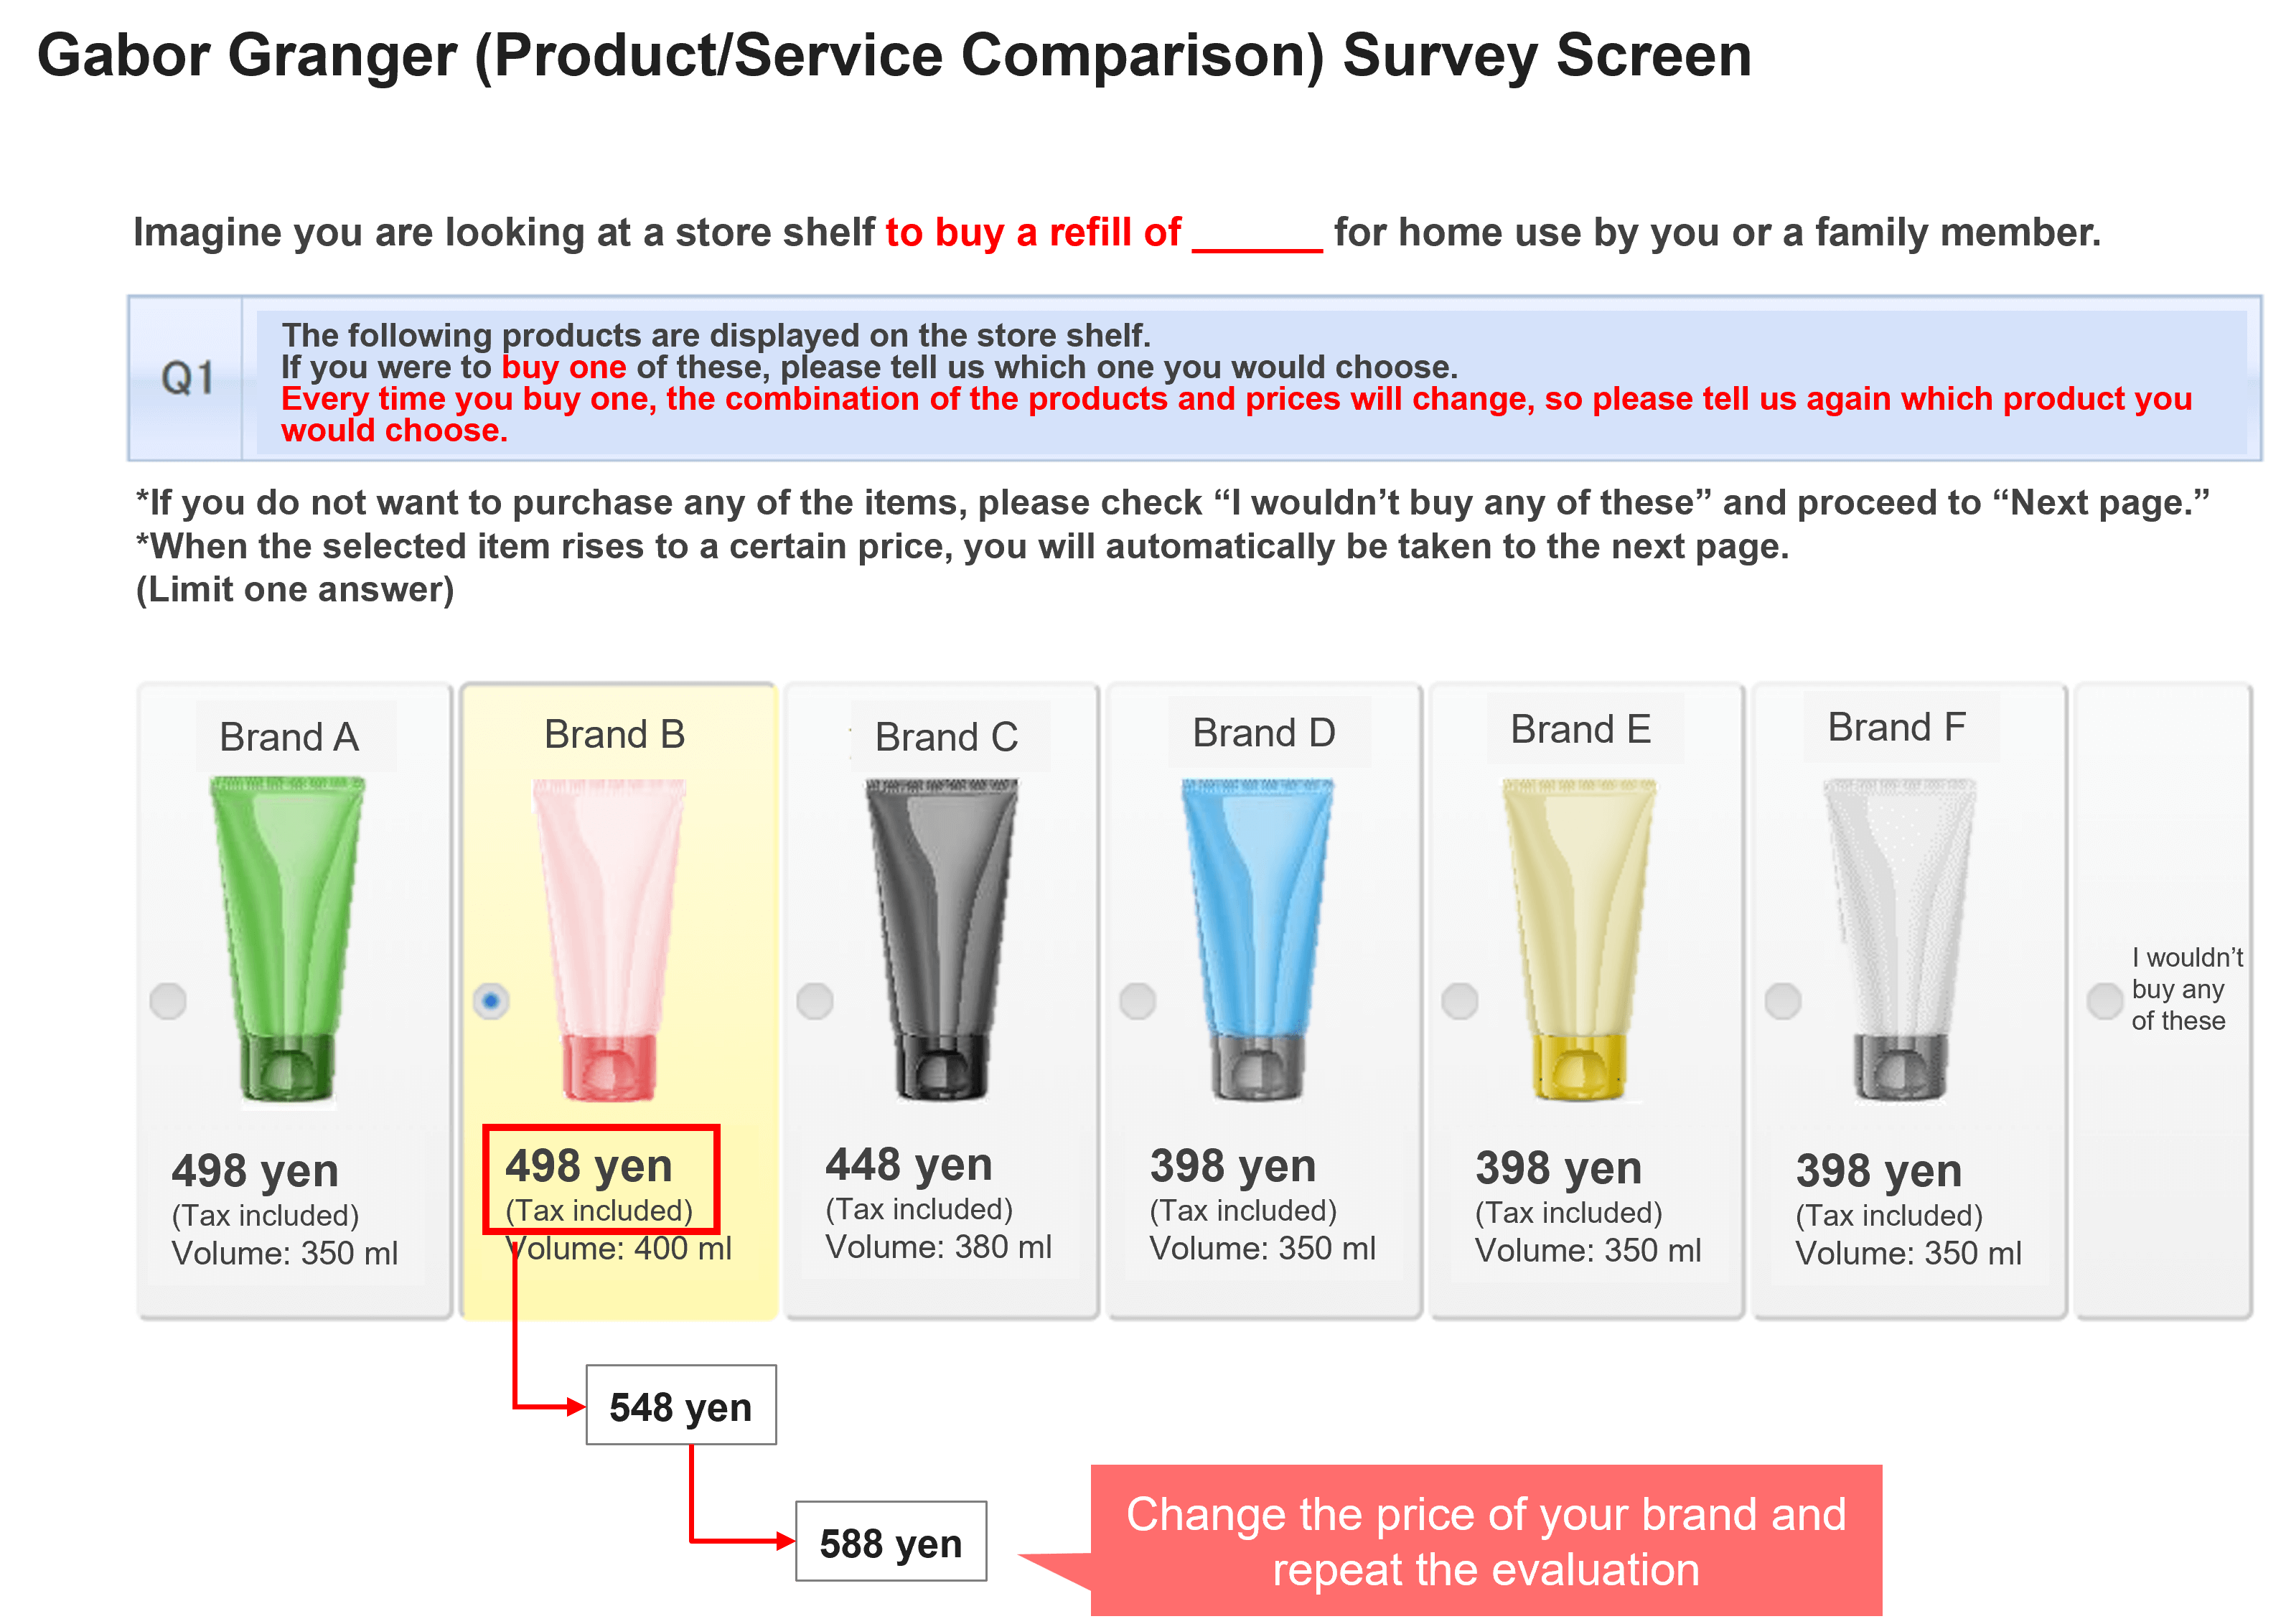
Check Competitiveness at Envisaged Prices: Gabor Granger (Competitive Survey Pattern)
This method presents your company’s product alongside competitors’ products and lets people choose one product they want to buy.
Changing the prices of your company’s products and repeating the questions reveals the price elasticity. The survey is carried out via a screen similar to that shown in the figure below.
Your company’s brand is presented alongside competitors’ products.
For example, if you are considering raising the price of your company’s Brand B, you can find out whether the users of Brand B would continue to choose Brand B even if the price went up to 498 yen, 548 yen, 588 yen, and so on while the prices of the competing brands remained the same.
On the other hand, if you are considering a price reduction, you can find out whether users of competing brands would choose Brand B (whether they would switch or not) if the price of Brand B were to decrease to 498 yen, 398 yen, 348 yen, and so on.
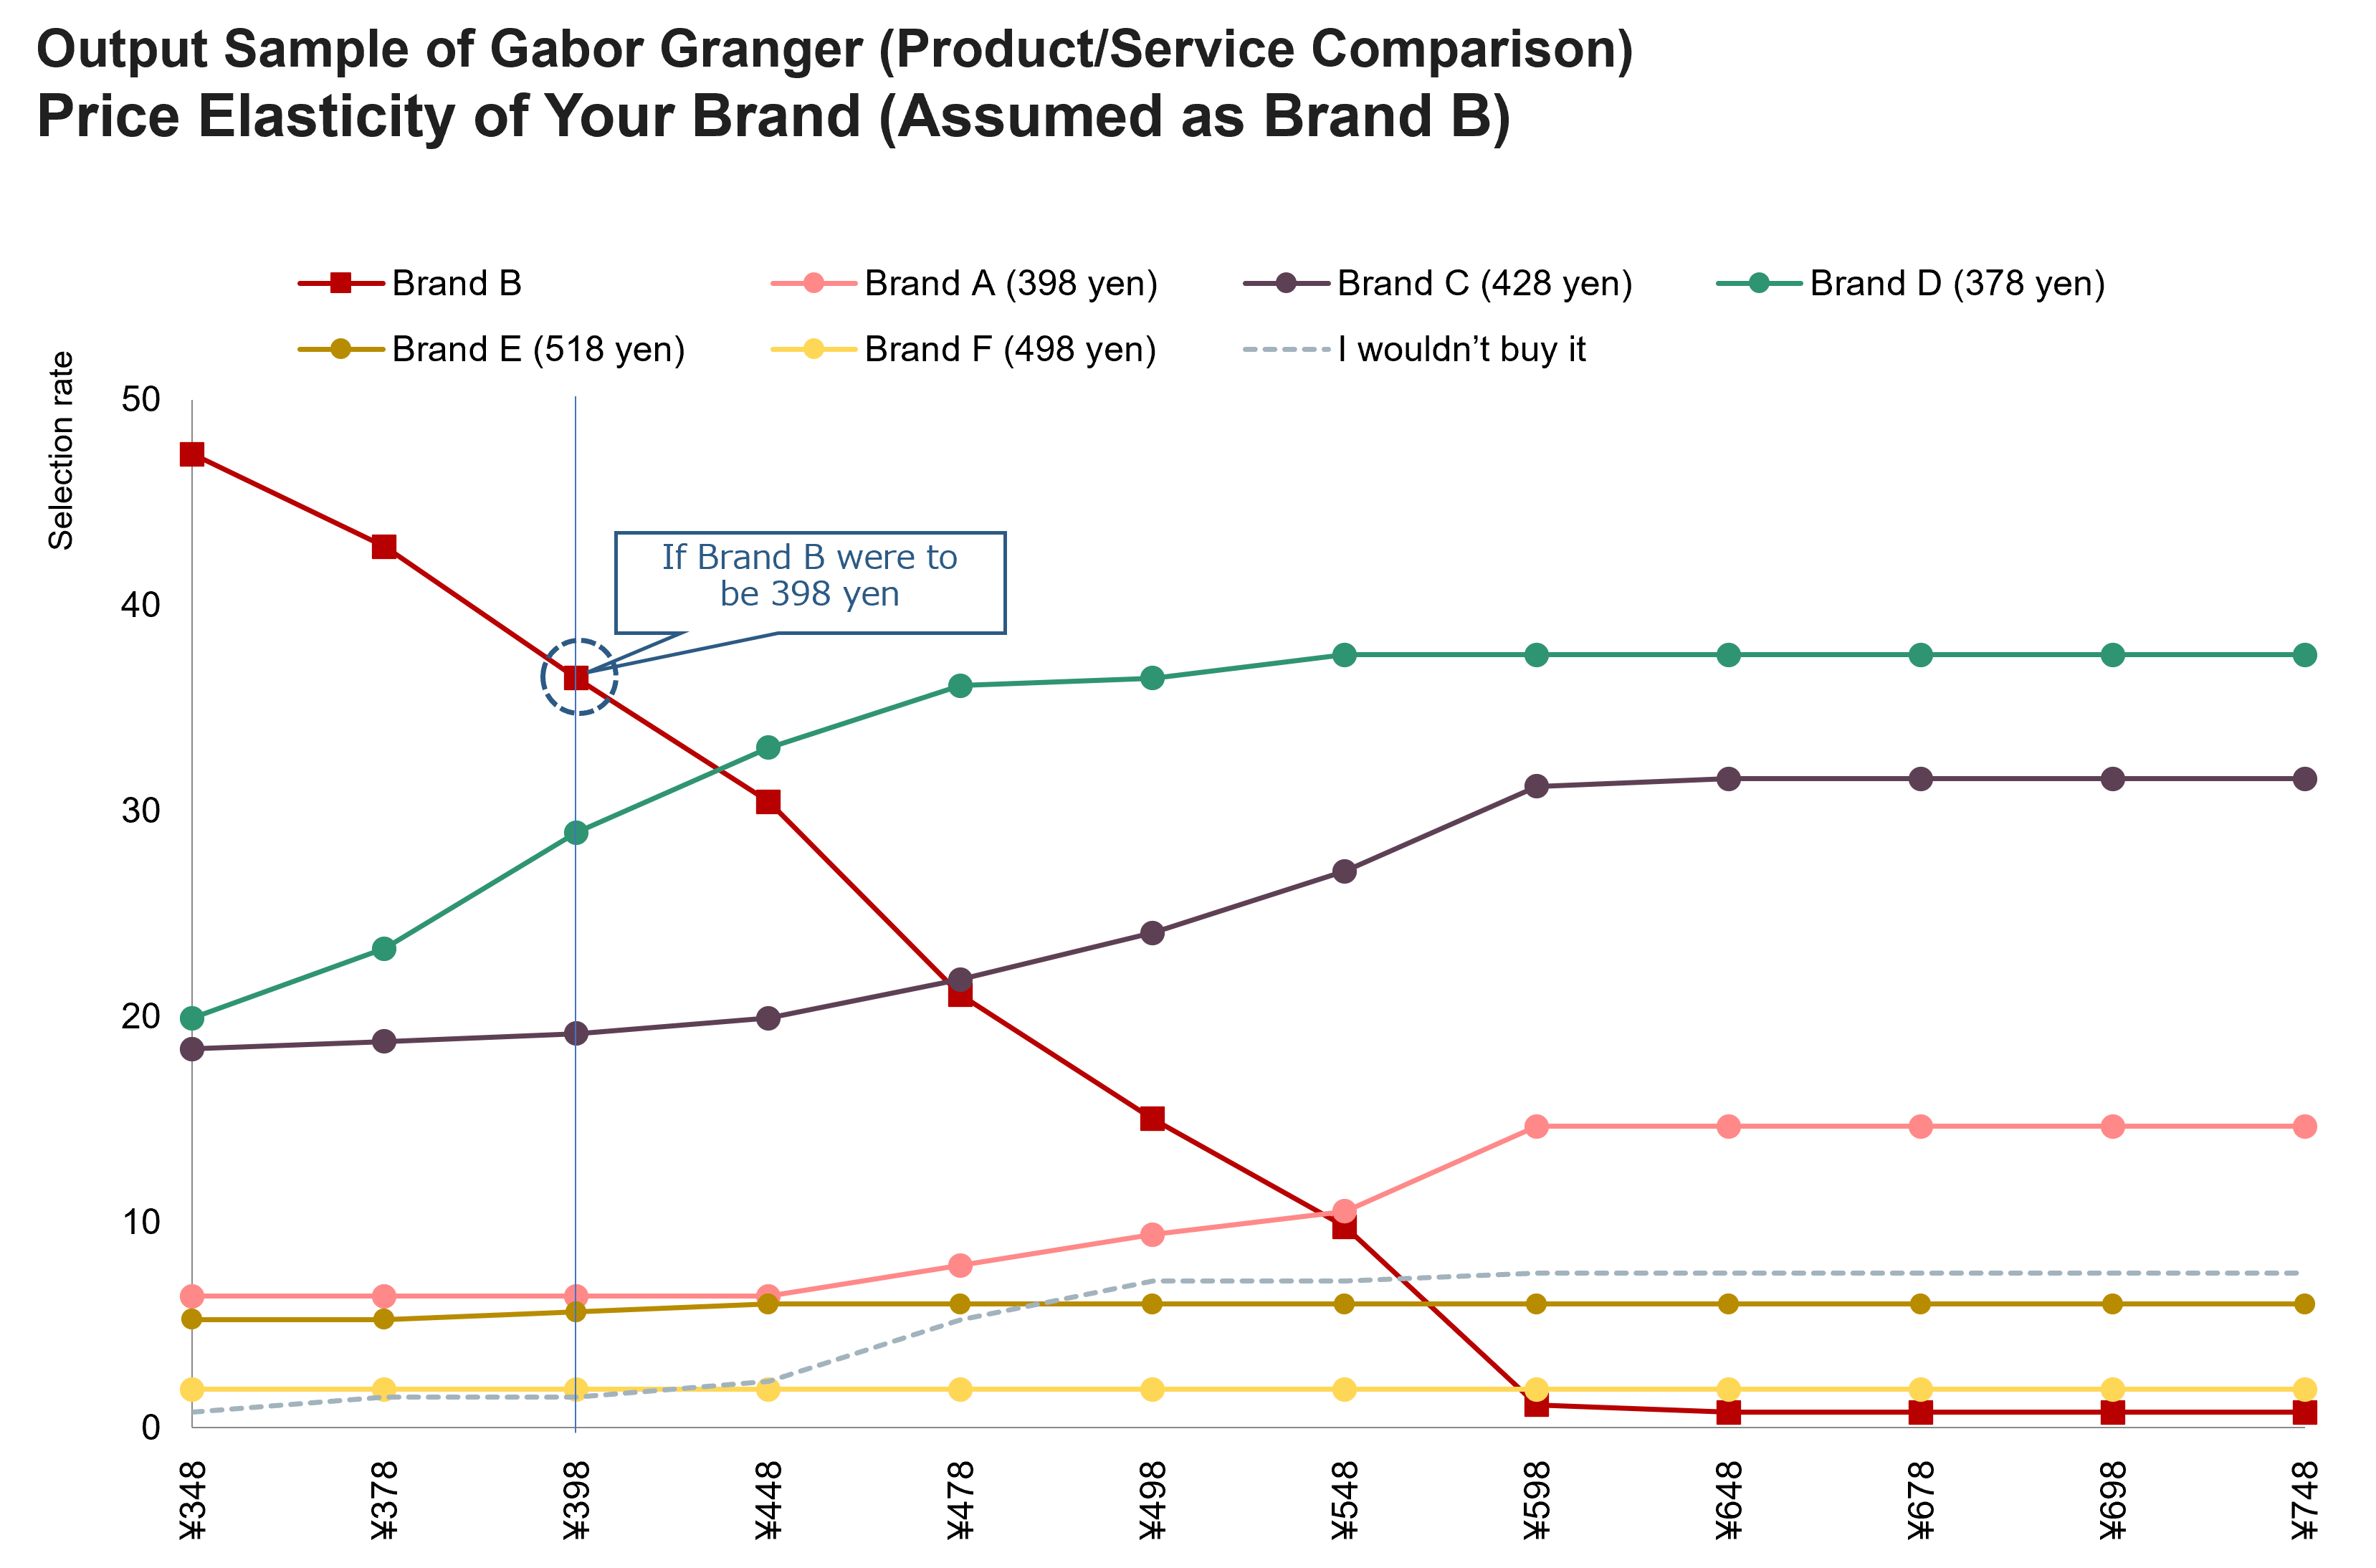
Three graphs can be generated based on the answers gathered from these questions. Based on price changes, the graphs show the resulting (1) changes in demand (price elasticity), (2) changes in market share, and (3) changes in inflows from and outflows to competing products. Here is a graph of price elasticity.
Fig.3
The horizontal axis is the price of your company’s Brand B, and the red line graph shows the percentage of people who would select Brand B at that price. As the price increases, the selection rate of Brand B decreases and the selection rate of competing products increases. We can see which competing products customers may plausibly switch to from Brand B.
This graph can be utilized to judge pricing by noting the price at which the selection rate would be lost to competing products if the price were further increased and the price at which the selection rate would be greatly reduced by any further price increase.
Conclusion
This article introduced some common questions and analysis methods for surveys that are used to inform pricing decisions. When introducing a new product into an existing category or changing the price of an existing product, the comparison with the competition (to assess competitiveness) is a very important factor. In addition to the above, there are various other price research methods, such as Brand Price Trade Off (BPTO), which allows companies to simulate price increases on not only their own products or services but also those of competitors, and methods that are appropriate for categories in which purchases are frequent. It is also recommended that these methods be combined in a single survey. Companies would be well advised to take different information about pricing from each analysis method and evaluate it holistically to determine the “optimal price.”
Reference Materials: Graduate School of Management, GLOBIS University (2019). GLOBIS MBA Marketing, DIAMOND, INC. Philip Kotler / Gary Armstrong / Marc Oliver Opresnik (2022). Marketing: An Introduction (translation directed by Naoto Onzo), Maruzen Publishing Co.,Ltd. Mitsuo Wada / Naoto Onzo / Toshihiko Miura (2022). Marketing Strategy, Yuhikaku Arma
Reproduction and Quotation
◆This report is copyrighted by INTAGE Inc. Please check the following prohibitions and precautions, and specify the source when reproducing or quoting this report. “Source: INTAGE “Knowledge Gallery” article published MM/DD/YYYY article”
◆The following are prohibited: ・Alteration of this article in full or in part ・Sale or publication of this article in full or in part ・Uses that are against public order and morality, and uses connected with illegal activities ・Reproducing or quoting panel data* for the purpose of advertising or promoting companies, products, or services *Panel data include: SRI+, SCI, SLI, Kitchen Diary, Car-kit, MAT-kit, Media Gauge, i-SSP, etc.
◆Other precautions: ・INTAGE Inc. shall not be liable for any trouble, loss, or damage caused by the use of this report ・These usage rules do not restrict the use of quotations or other uses permitted under the Copyright Act of Japan
◆For inquiries about reproduction and quotation, click here.