1. Introduction: Accelerating Pace of Change in Daily Life
It was on January 30, 2020 that World Health Organization (WHO) Director-General Tedros Adhanom declared a “public health emergency of international concern” in response to the outbreak of the novel coronavirus (COVID-19) in China. Three years and two months later, on May 5, 2023, Director-General Tedros declared the end of COVID-19 as a public health emergency. At the same time, he emphasized that this “does not mean COVID-19 is over as a global health threat. The virus continues to claim lives”. He also stated that “it is time for countries to transition from emergency mode to managing COVID-19 alongside other infectious diseases”, and urged people not to let their guard down.
In Japan, the rules for wearing masks were relaxed in the spring of 2023, and there was much talk about “unmasked” graduation and entrance ceremonies. In addition, on May 8, the classification of COVID-19 under the Infectious Diseases Control Law was lowered from “Category 2” – the same level as tuberculosis and SARS – to “Category 5”, putting it on a par with seasonal influenza. As a result of this, measures taken by the government and prefectures in accordance with the law will change. In principle, this means the elimination of measures such as the recommended hospitalization of infected people, the isolation of infected persons and those in close contact with infected persons, and restrictions on entry into Japan. In addition, medical expenses and vaccinations are likely to change from being fully paid for by the government to requiring some co-payment in the future.
Three years and two months after the WHO’s declaration of a state of emergency, this latest declaration will surely bring about more and more changes to the landscape of our daily lives.
For the second installment of this series, let’s begin by looking at “shopping”.
2. Fading Concerns and Concerns that Won’t Go Away: Persistent Anxiety About Household Finances
Let’s take a look at the trends in anxiety about COVID-19 infection and household finances, as well as attitudes towards cutting down on spending, which we have been following in our tracking survey.
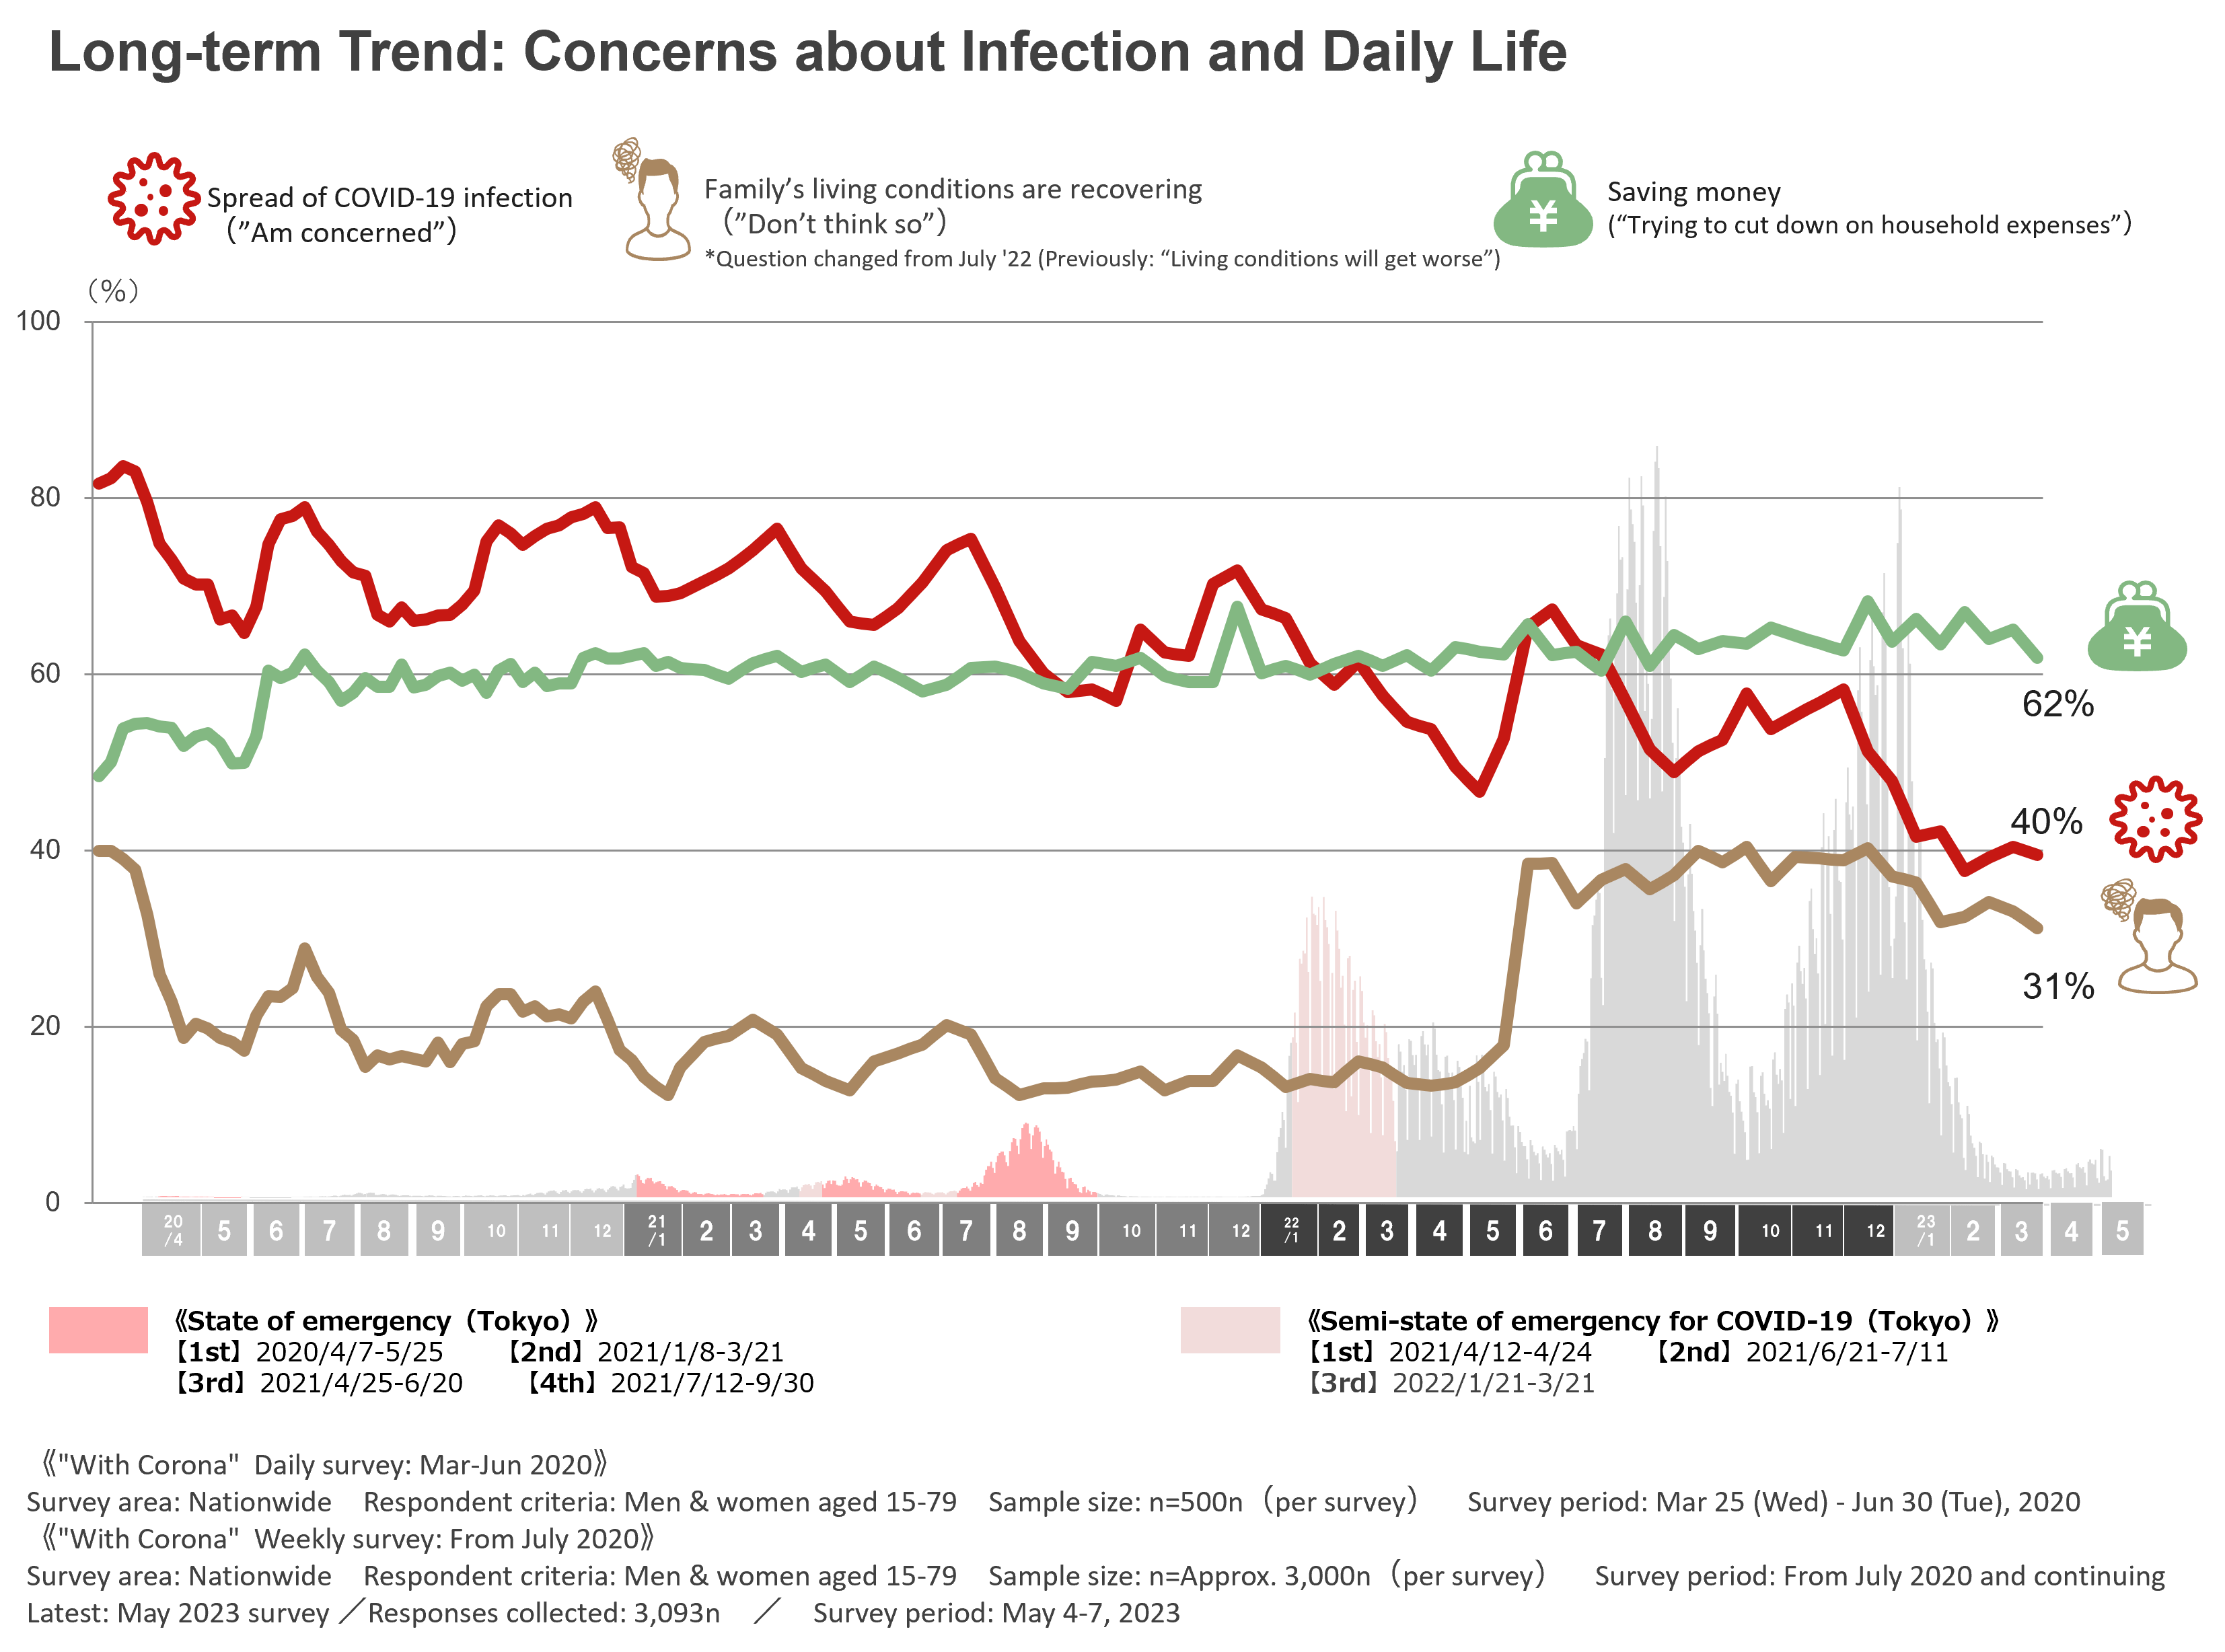
Anxiety about infection is at its lowest since the start of the survey, with the latest level at 40%. There is a strong positive correlation between the number of new cases of infection and anxiety about infection, with anxiety repeatedly falling and rising in accordance with the number of new cases. However, with the spread of vaccination, this trend has weakened with each repeated “wave” of infection. As a result, after the sixth wave (around January-February 2022), there was not as much concern as before, and during the latest (eighth) wave (around January 2023), the level of concern was less than 60% even at the peak, and decreased to less than 40% as the no. of cases decreased. Going forward, anxiety about infection is expected to diminish further, to around the same level as influenza, with the reclassification to “Category 5” and the expected development of new treatments.
Fig.1
On the other hand, more than 30% of respondents answer “Don’t think so” when asked if they expect their living conditions to recover, and since the question format was changed in the summer of 2022, the percentage has hovered between 40% and 35%, with no notable decline. Although some major companies and certain industries – such as the automobile industry – have been raising salaries since the beginning of this year, expectations for a recovery in the quality of life due to improved conditions do not seem to extend to the general public as a whole. In addition, there has been no major shift in attitudes about saving money since the level rose to around 60% after the outbreak of COVID-19 (around June 2020). Since then, the underlying reason for anxiety about household finances and interest in economizing has changed from “pandemic-driven employment and income insecurity” to “the rising prices of goods and services”. As a result, interest in belt-tightening has been on a gradual upward trend since the end of last year, when prices rose further, and is still at a high 62% at present.
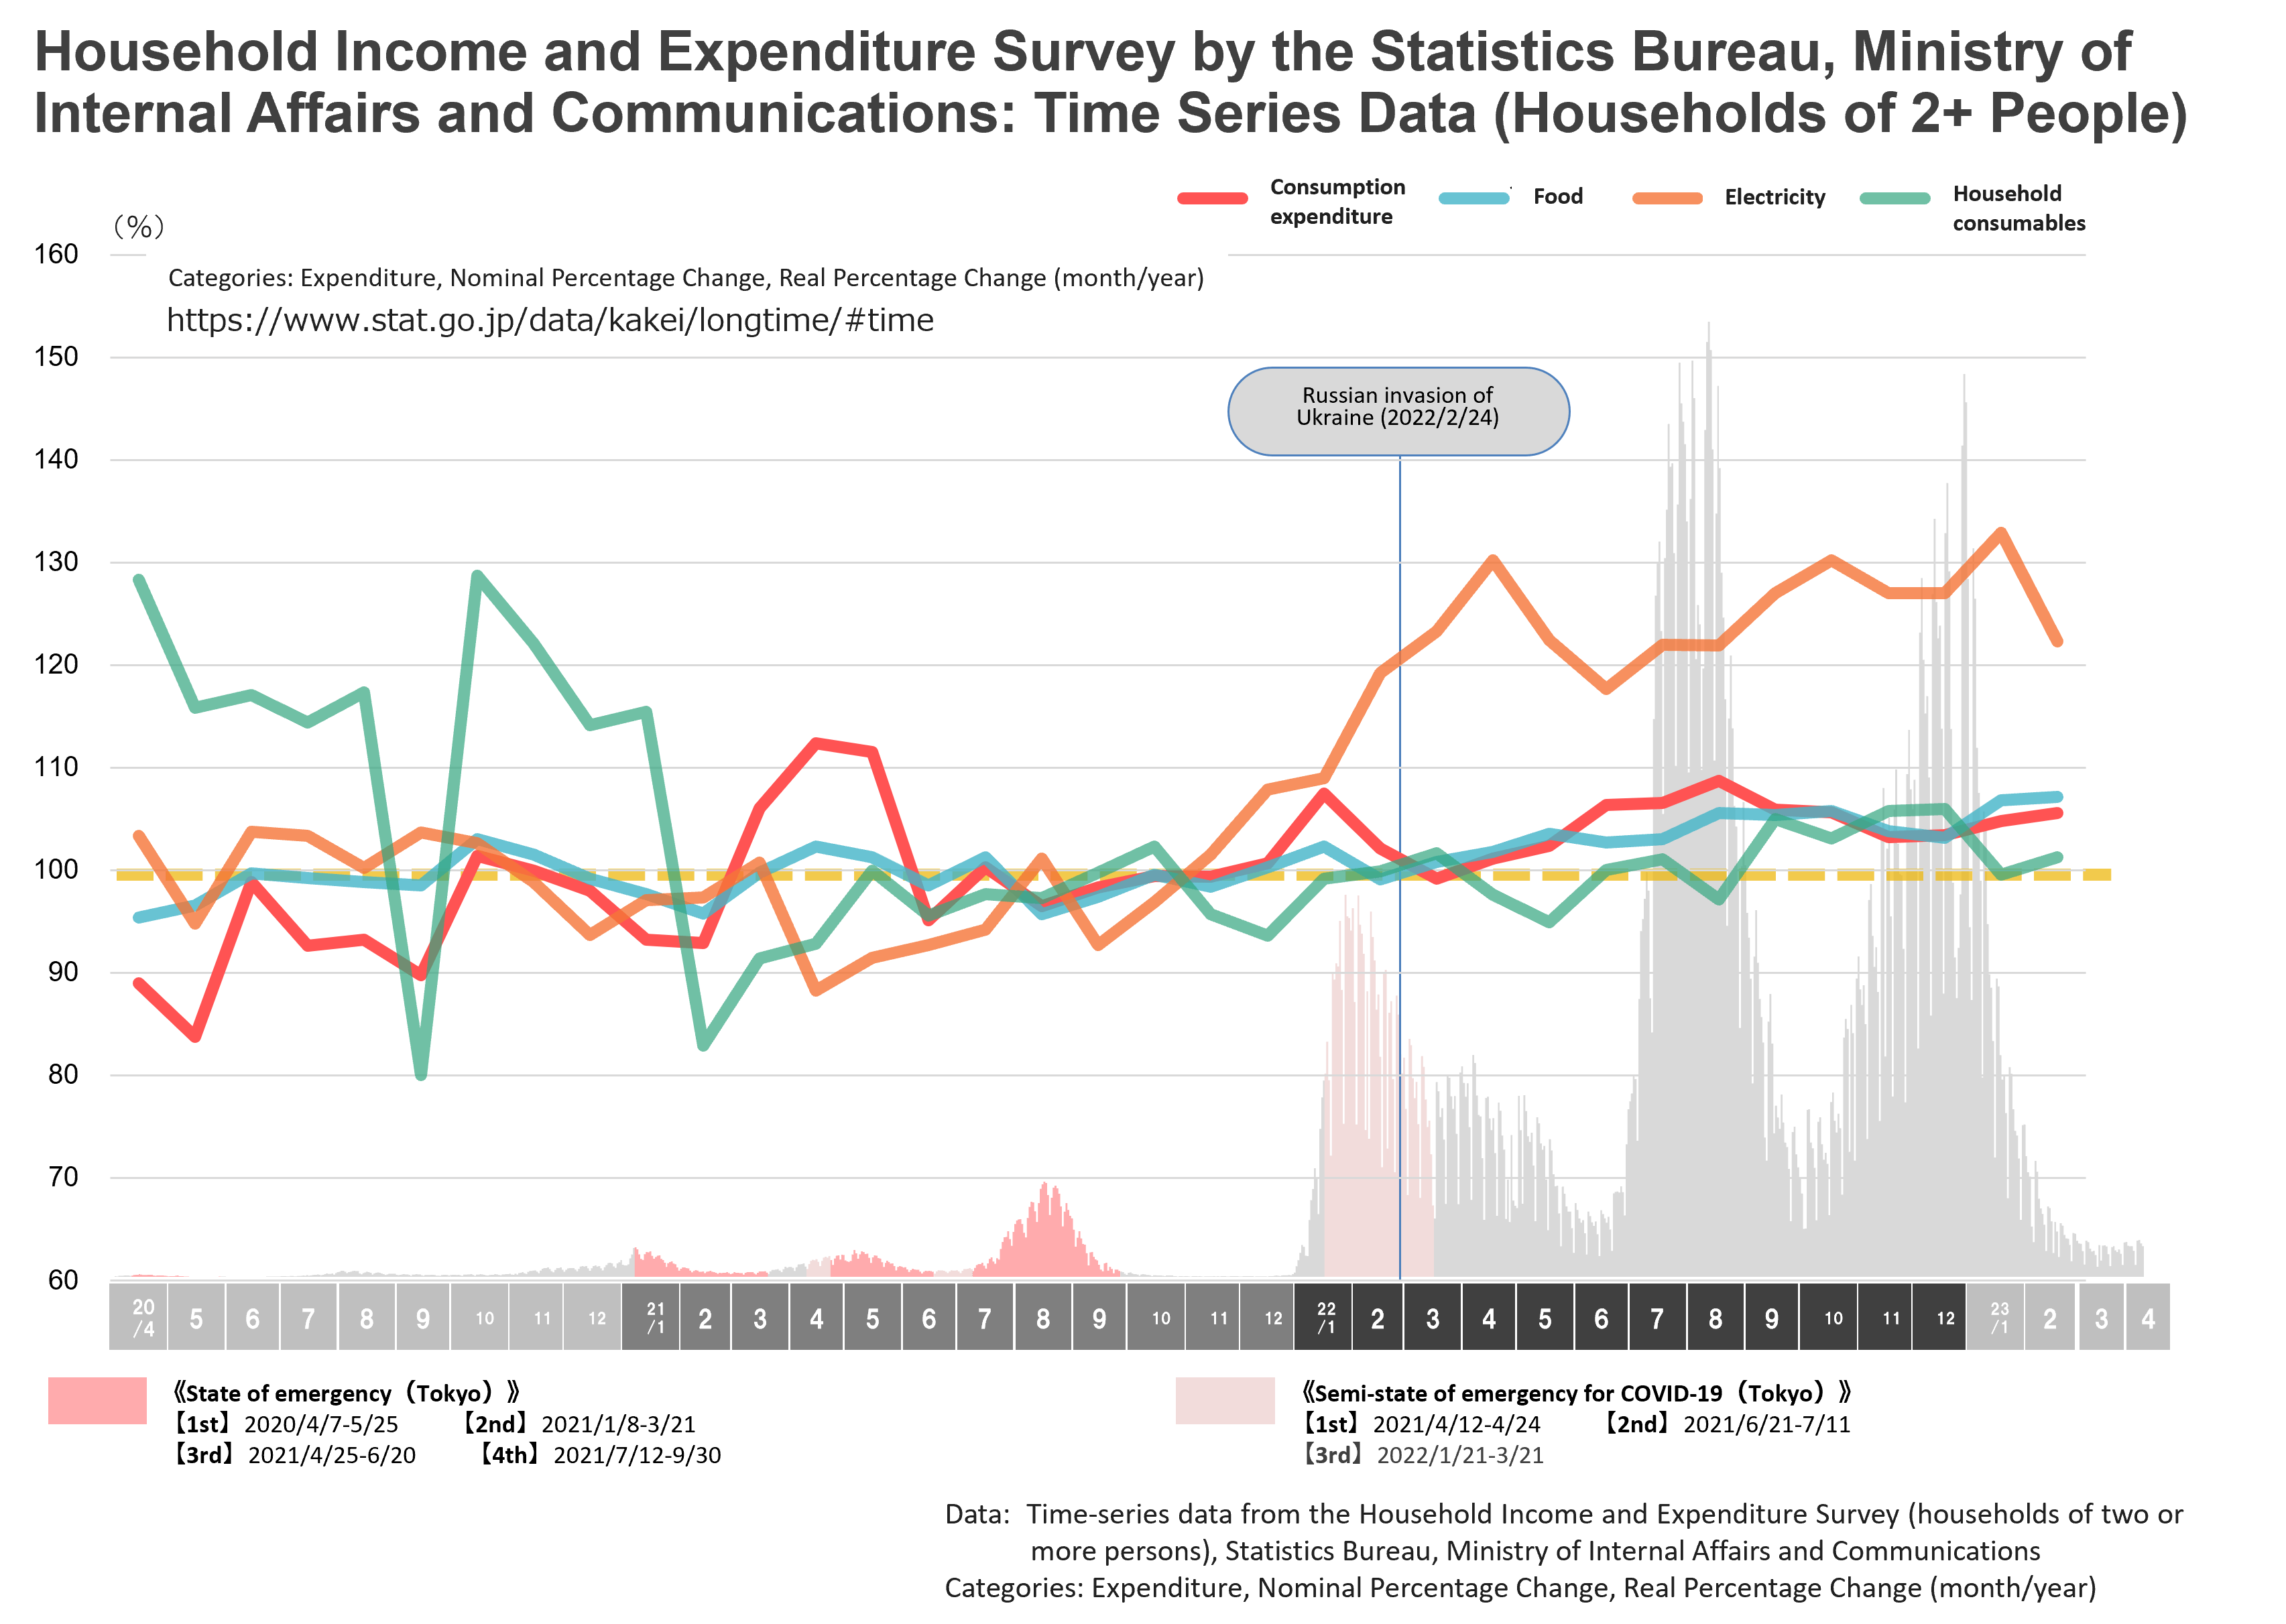
Let’s also take a look at the data on household spending from the Statistics Bureau of the Ministry of Internal Affairs and Communications. Consumption expenditure has been rising gradually since the end of 2021, when there was a marked increase in electricity prices. Food-related spending has also been rising due to price increases from the beginning of 2022 for cooking oil and many other foods and condiments*1. (Fig.2) Prices are rising not only for food products but also for daily sundries, and due to this sense that all aspects of daily life are threatened by rising prices, it is hard to feel at ease. For more details on price hike trends, please refer to our recent release, “Prices No Longer Surging, but Still High: Is Rice Making a Comeback?” (April 24, 2023).*2
Fig.2
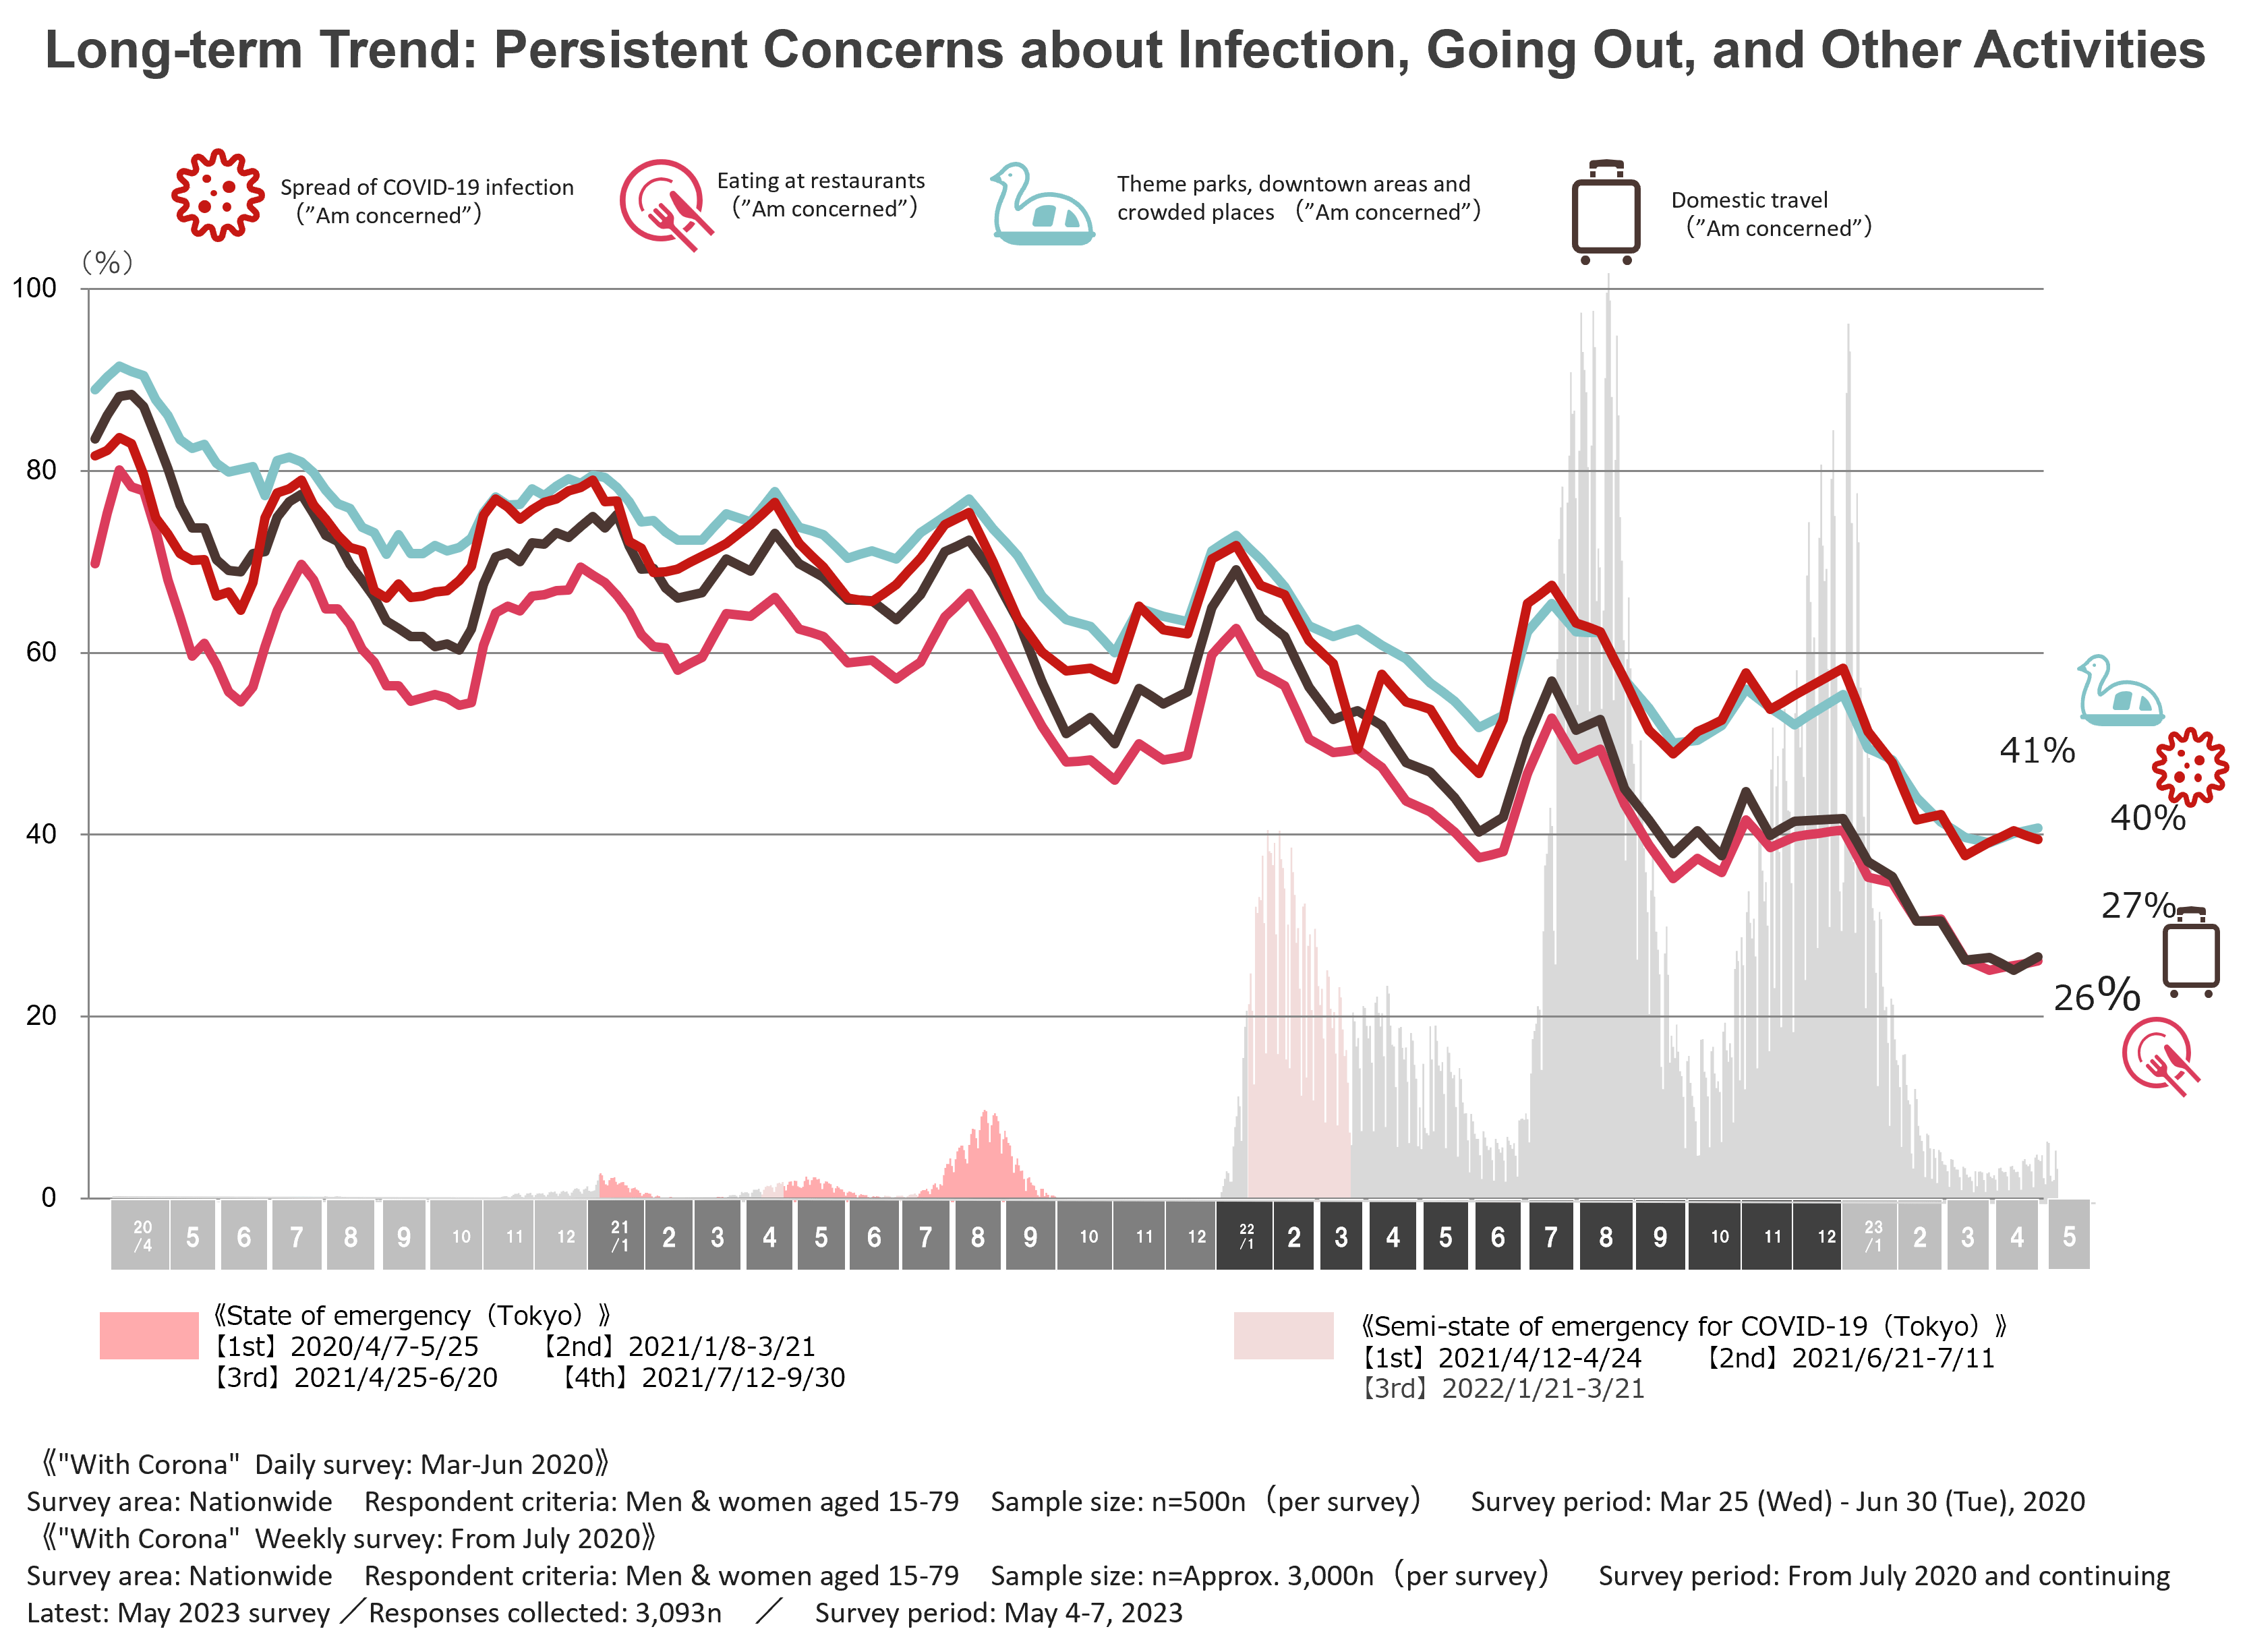
Next, let’s look briefly at the data on behavioral anxiety. Infection anxiety and behavioral anxiety are strongly correlated, and as infection anxiety decreases, behavioral anxiety shows the same trend. The latest scores show declines in concern about all behaviors, including “Eating at restaurants” (26%), “Domestic travel” (27%), and “Going to theme parks, downtown areas, and crowded places” (41%), to their lowest levels since the survey began.
Fig.3
Long-term Trend: Persistent Concerns about Infection, Going Out, and Other Activities During this year’s Golden Week, the media reported extensively on the significant recovery in tourism and the number of people returning to their hometowns. Non-reserved seats on the Tokaido Shinkansen (from Tokyo), for example, apparently reached 180% occupancy on the morning of May 3*3. Behavioral anxiety seems likely to diminish further, along with concern about infections.
3. Changes in Shopping Behavior: The Surge of Drugstores
Next, let’s focus on the theme of this series, the impact of the COVID-19 pandemic – i.e., what has changed, and what signs of a new way of life have taken root? For this installment, we will look specifically at shopping behavior and the shift to drugstores.
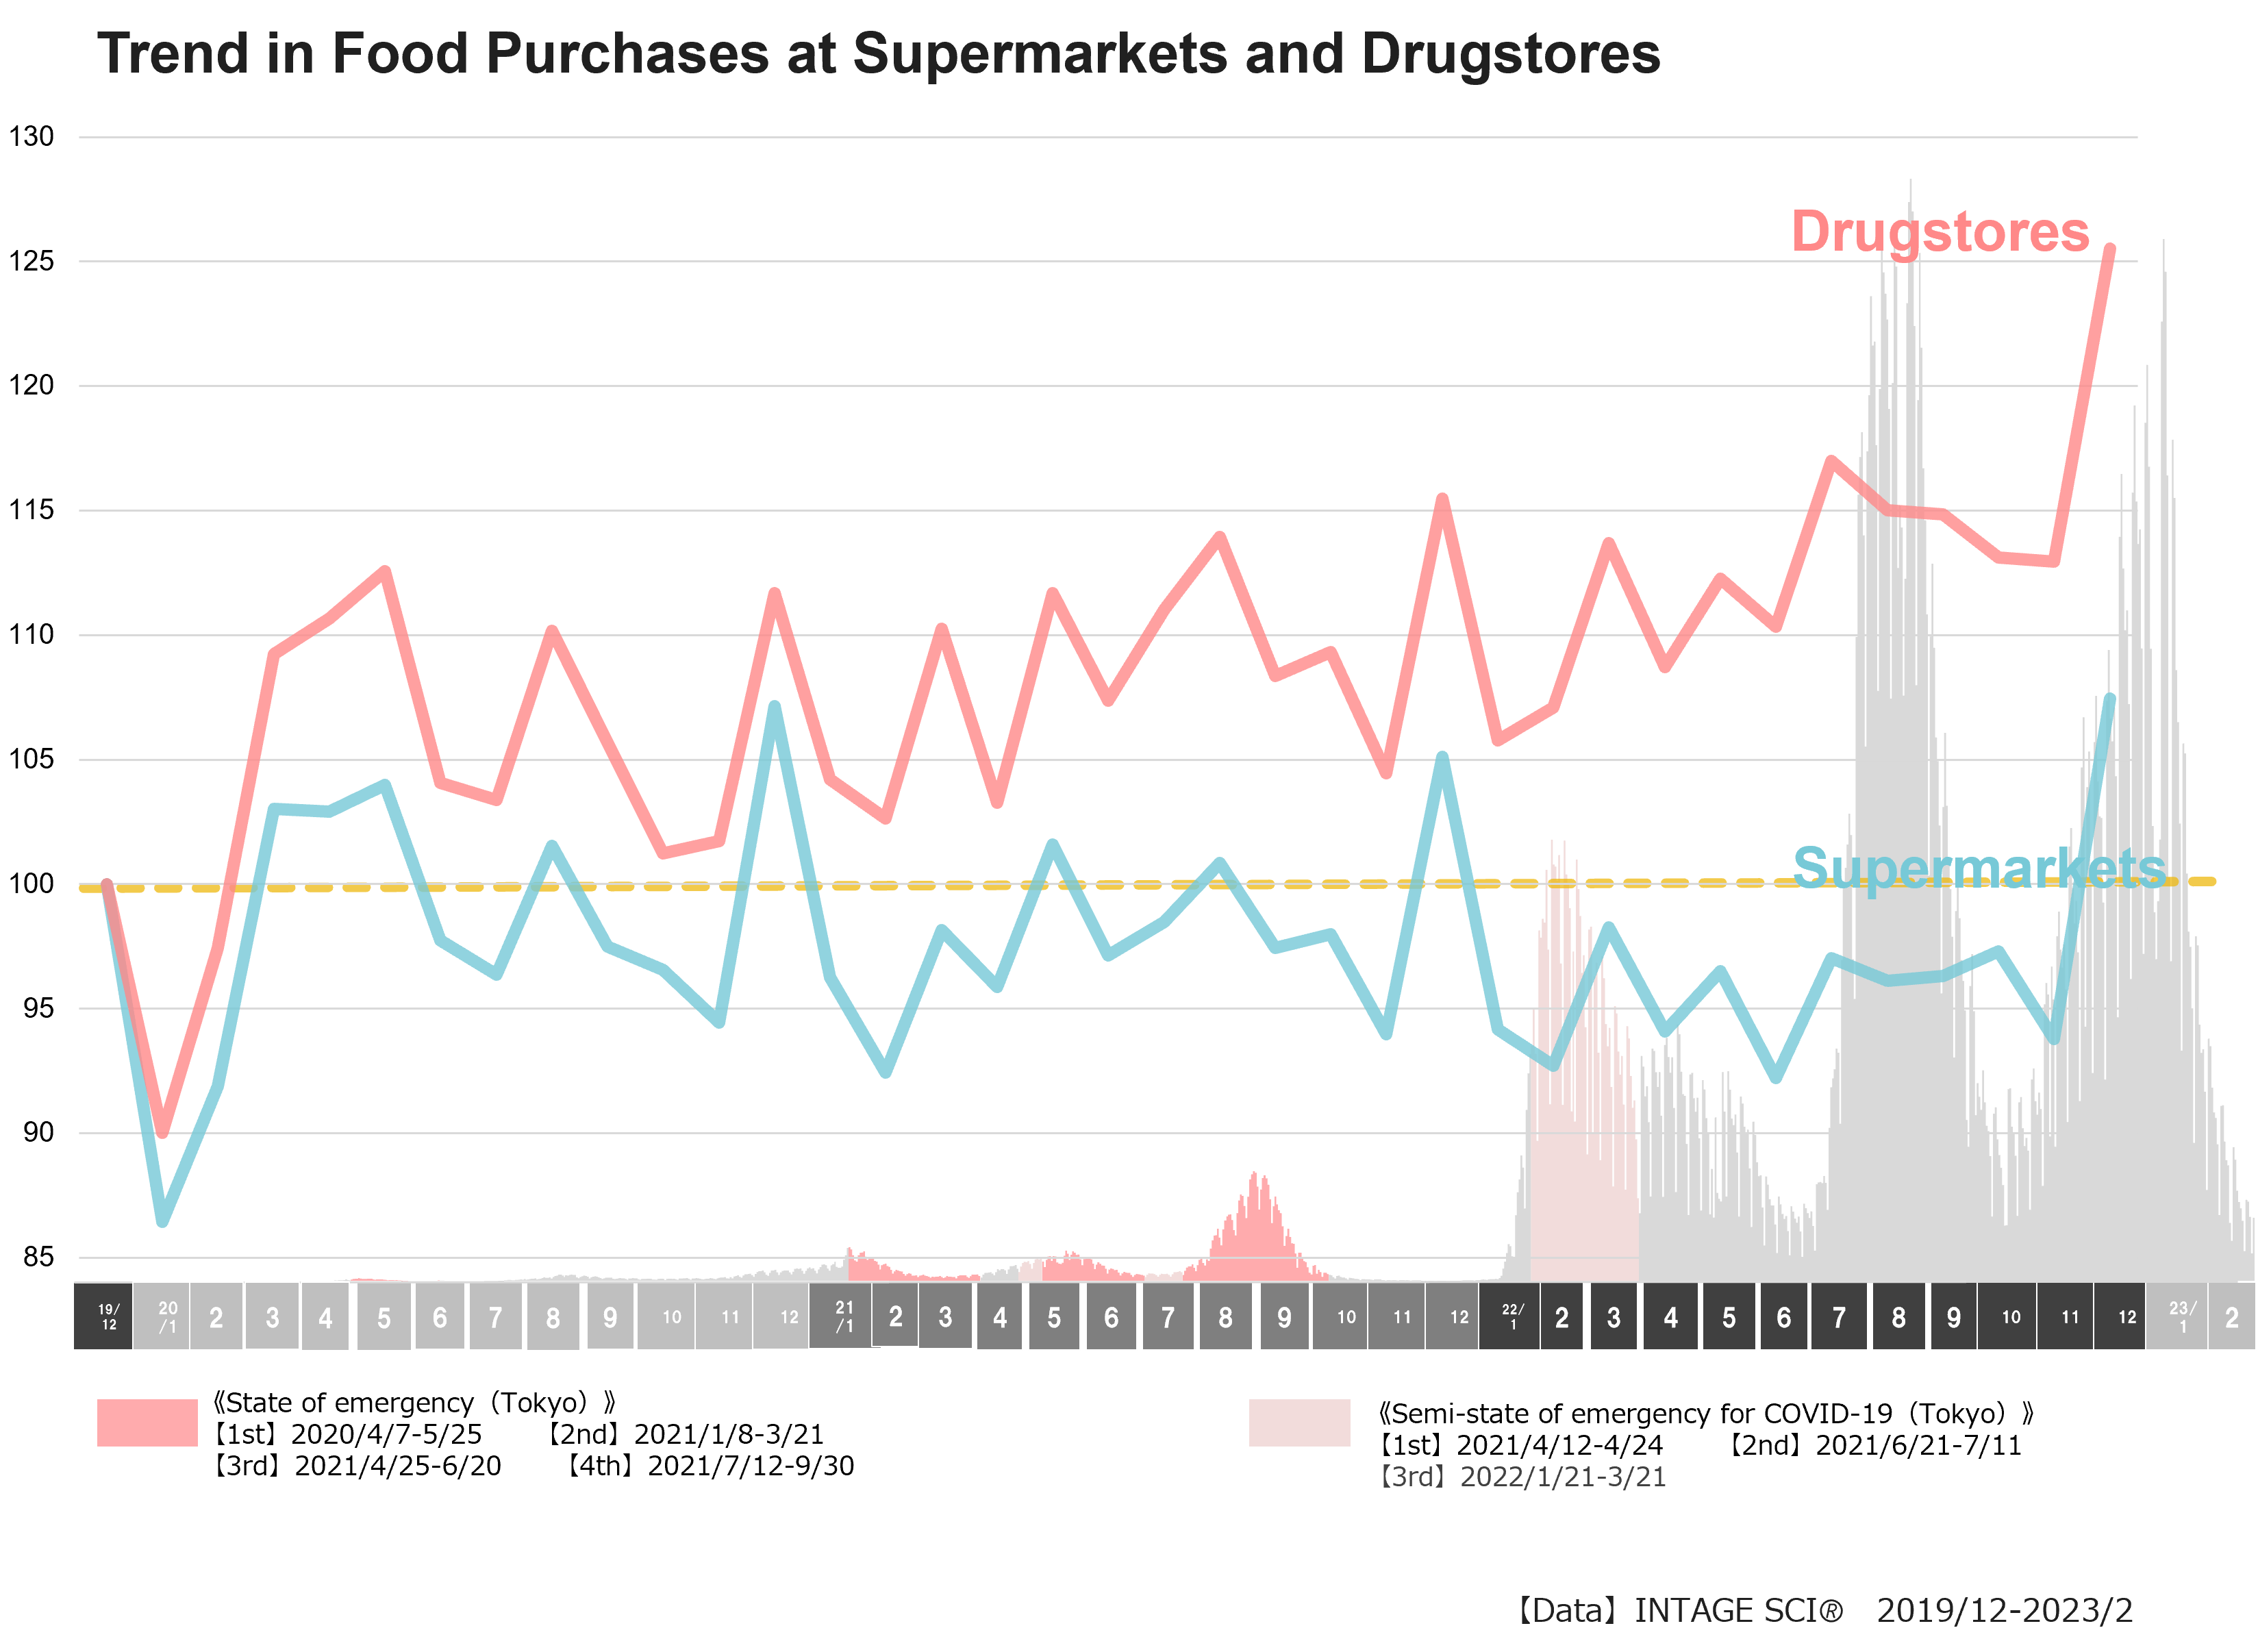
The chart below shows time-series data on food purchases in supermarkets and drugstores using INTAGE’s Consumer Panel Survey (SCI) data, taking 2019 – before the COVID-19 outbreak – as the benchmark. Comparing the movement of these two channels after the COVID-19 outbreak, we can see that drugstores have been growing steadily. Supermarkets, on the other hand, have been below the 2019 benchmark (100) for almost the entire period with the exception of the end-of-year season, and have not been able to recover.
Fig.4
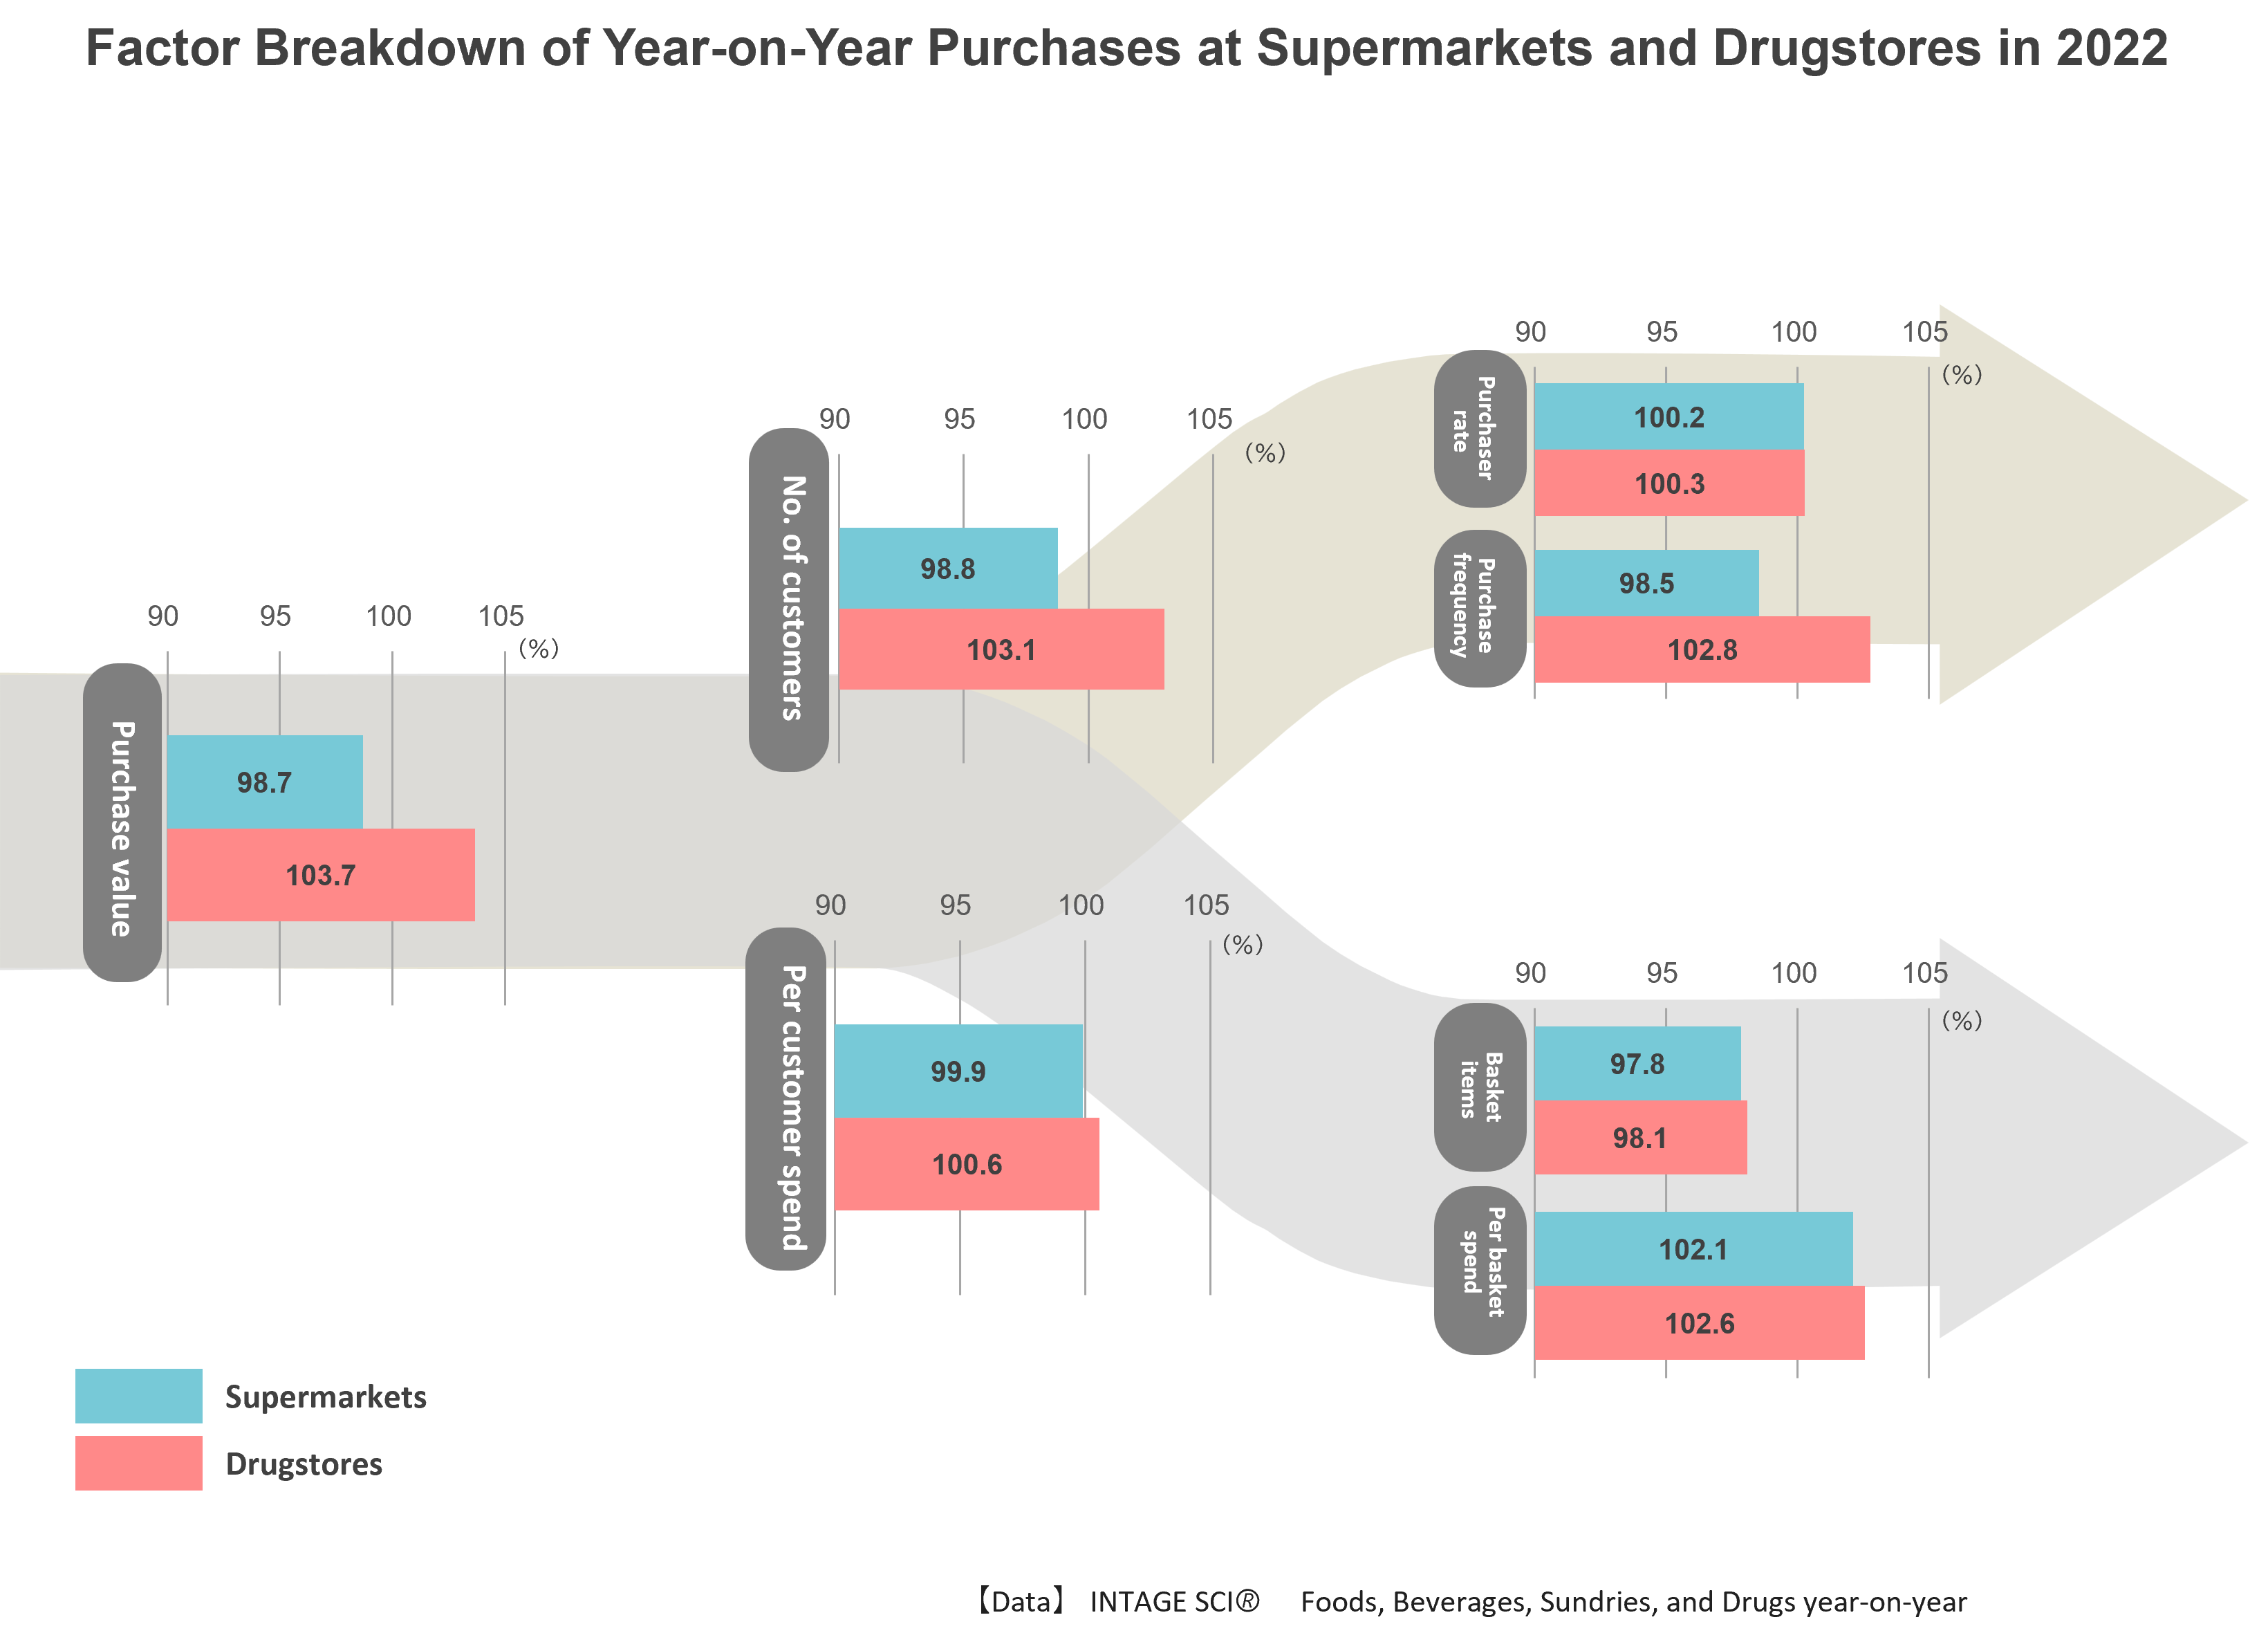
Deep dive into the positive and negative factors for drugstores and supermarkets using year-on-year comparison of purchase value (spending) in 2021 and 2022 shows that the number of basket items (number of items purchased) decreased in both channels due to price increases and other factors, but while the number of visitors to supermarkets remained sluggish (99%), drugstores saw increases in the number of visitors (103%) and in purchase frequency (103%). These two factors appeared to drive the increase in purchase value.
Fig.5
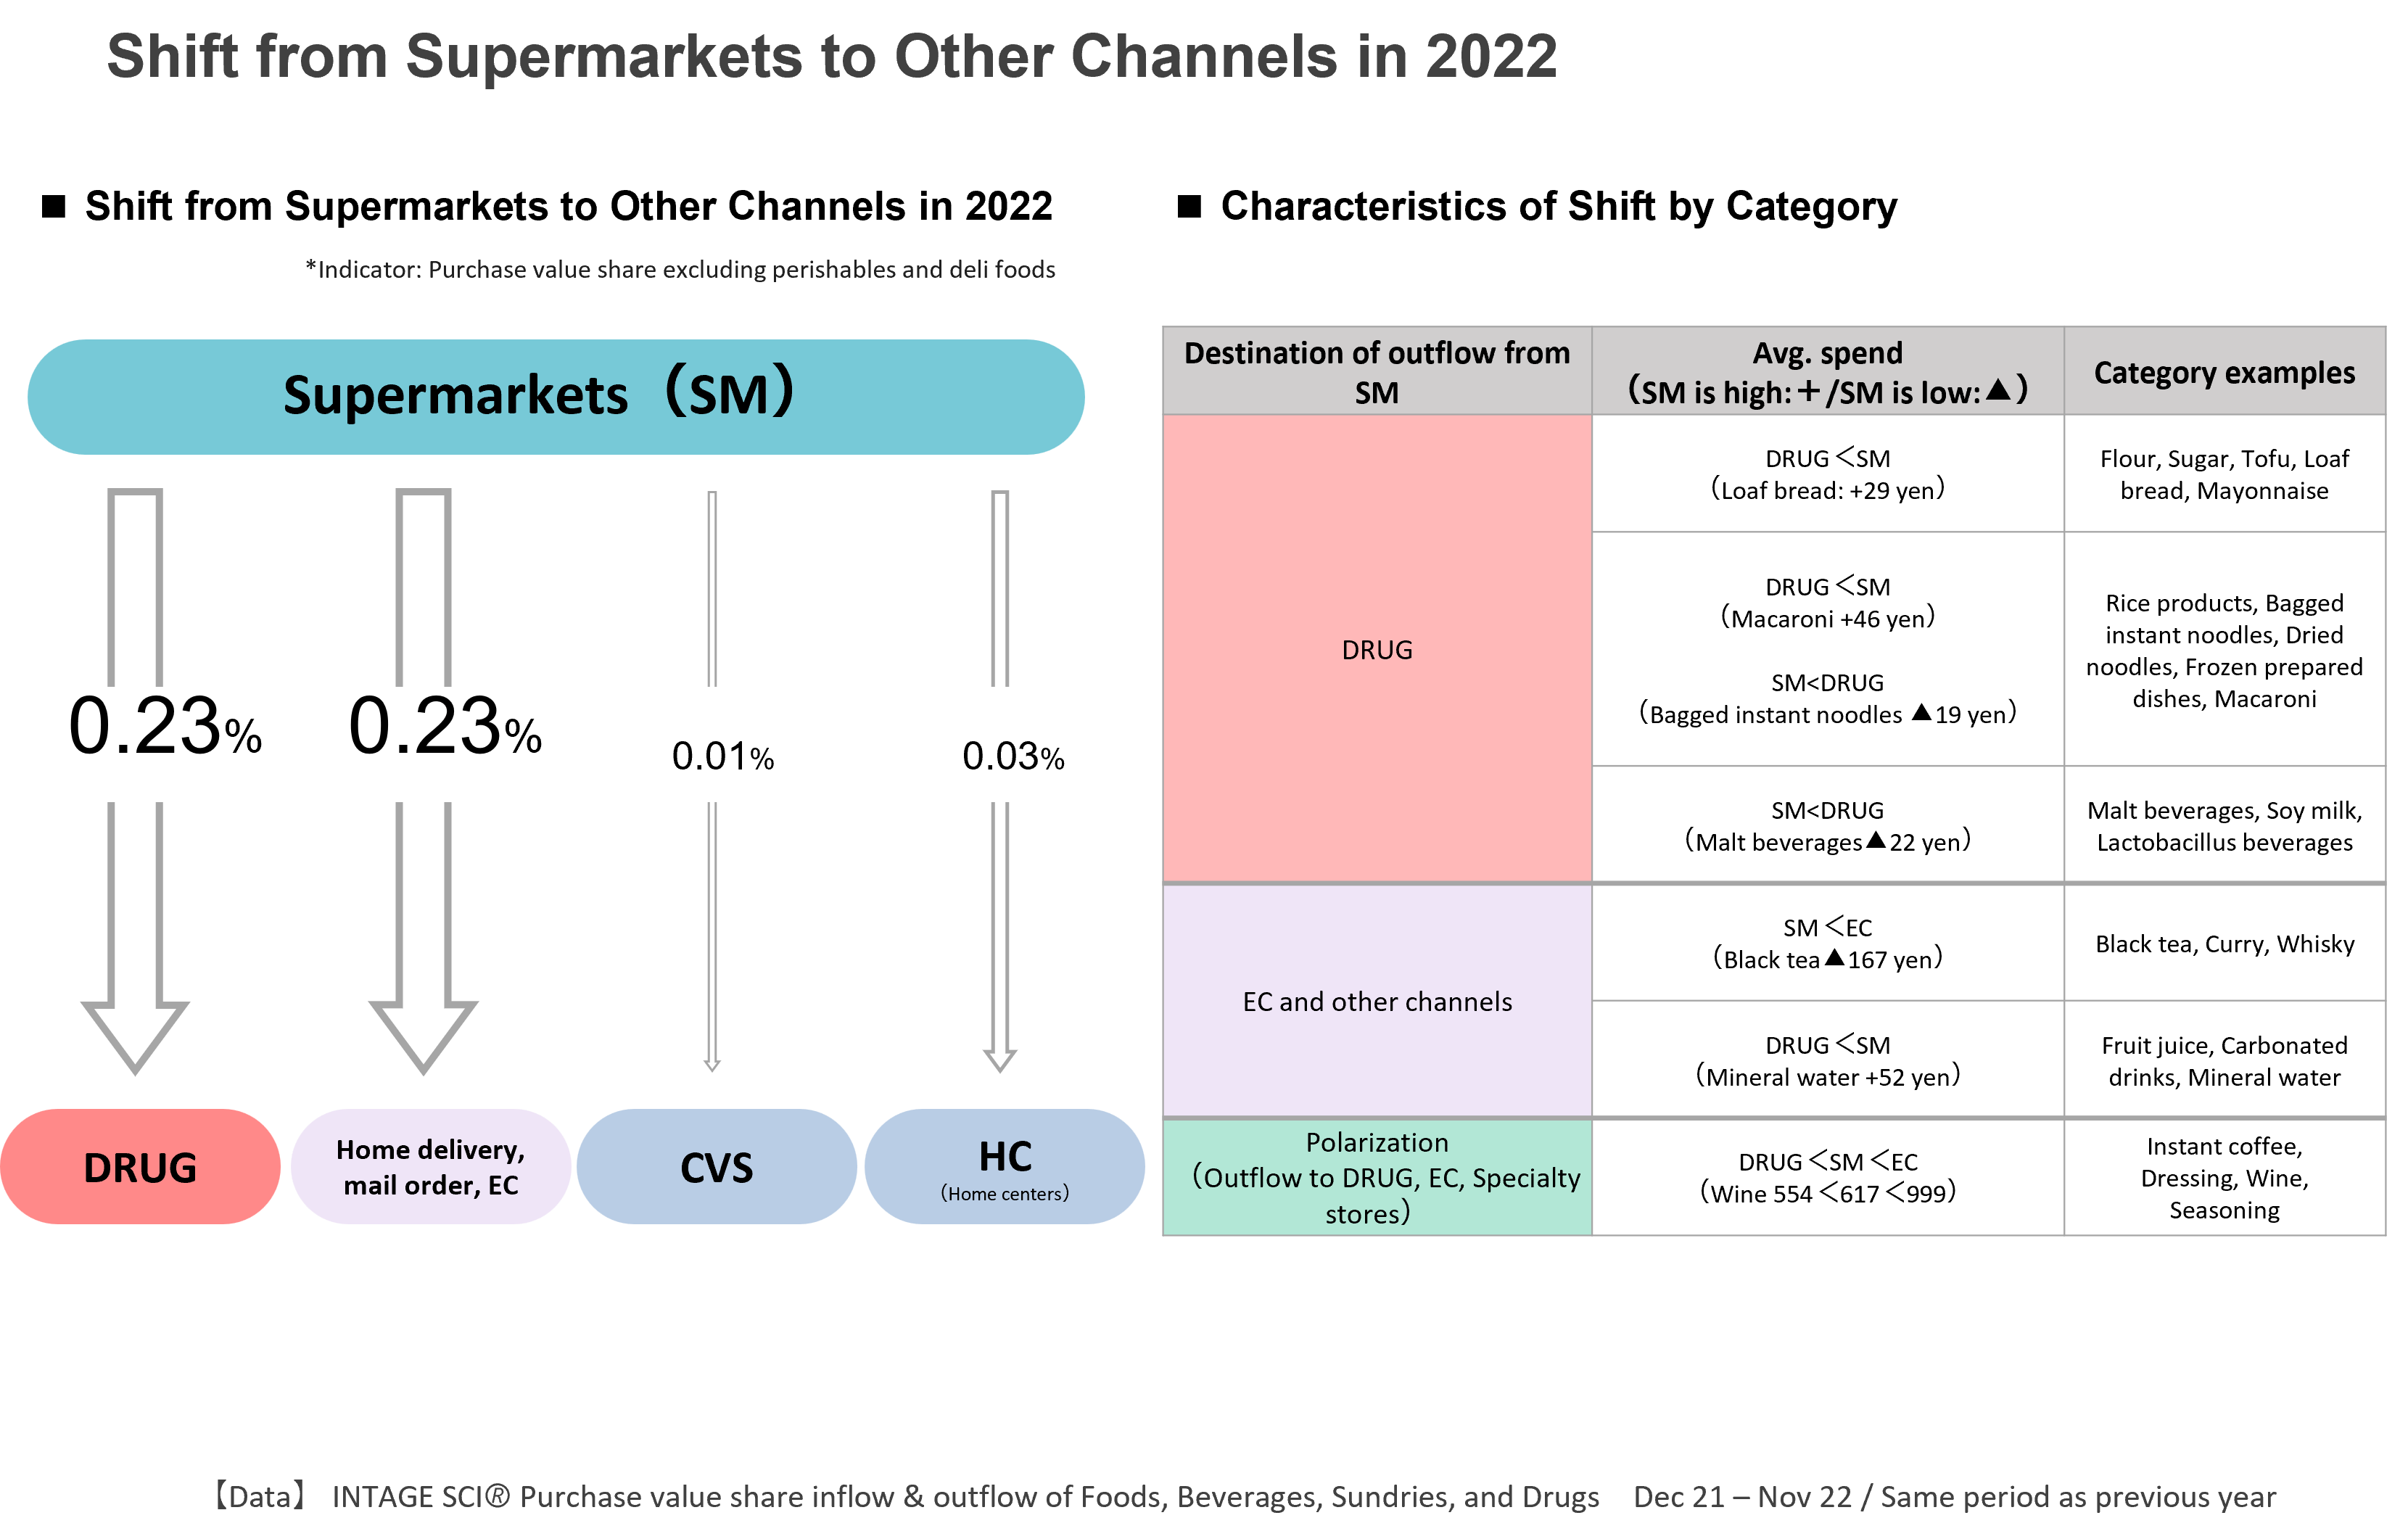
One underlying trend that would account for the above findings is the shift in spending from supermarkets to drugstores, home delivery, and mail order since 2021, when price increases for processed foods became more pronounced. This shift seems to have been driven in part by the fact that, as people are being hit by higher prices not only for groceries but also for electricity, water, gas, and other utilities, and are becoming more conscious of the need to protect their daily lives, they are buying the groceries for their daily meals in bulk at drugstores, home delivery outlets, and e-commerce sites. The product categories that are seeing a shift to drugstores include “Flour”, “Sugar”, “Bagged instant noodles”, “Dried noodles”, and “Frozen food”. In addition, categories that have seen a shift to home delivery and e-commerce include “Curry”, “Tea”, and “Mineral water”. (Fig.6)
Fig.6
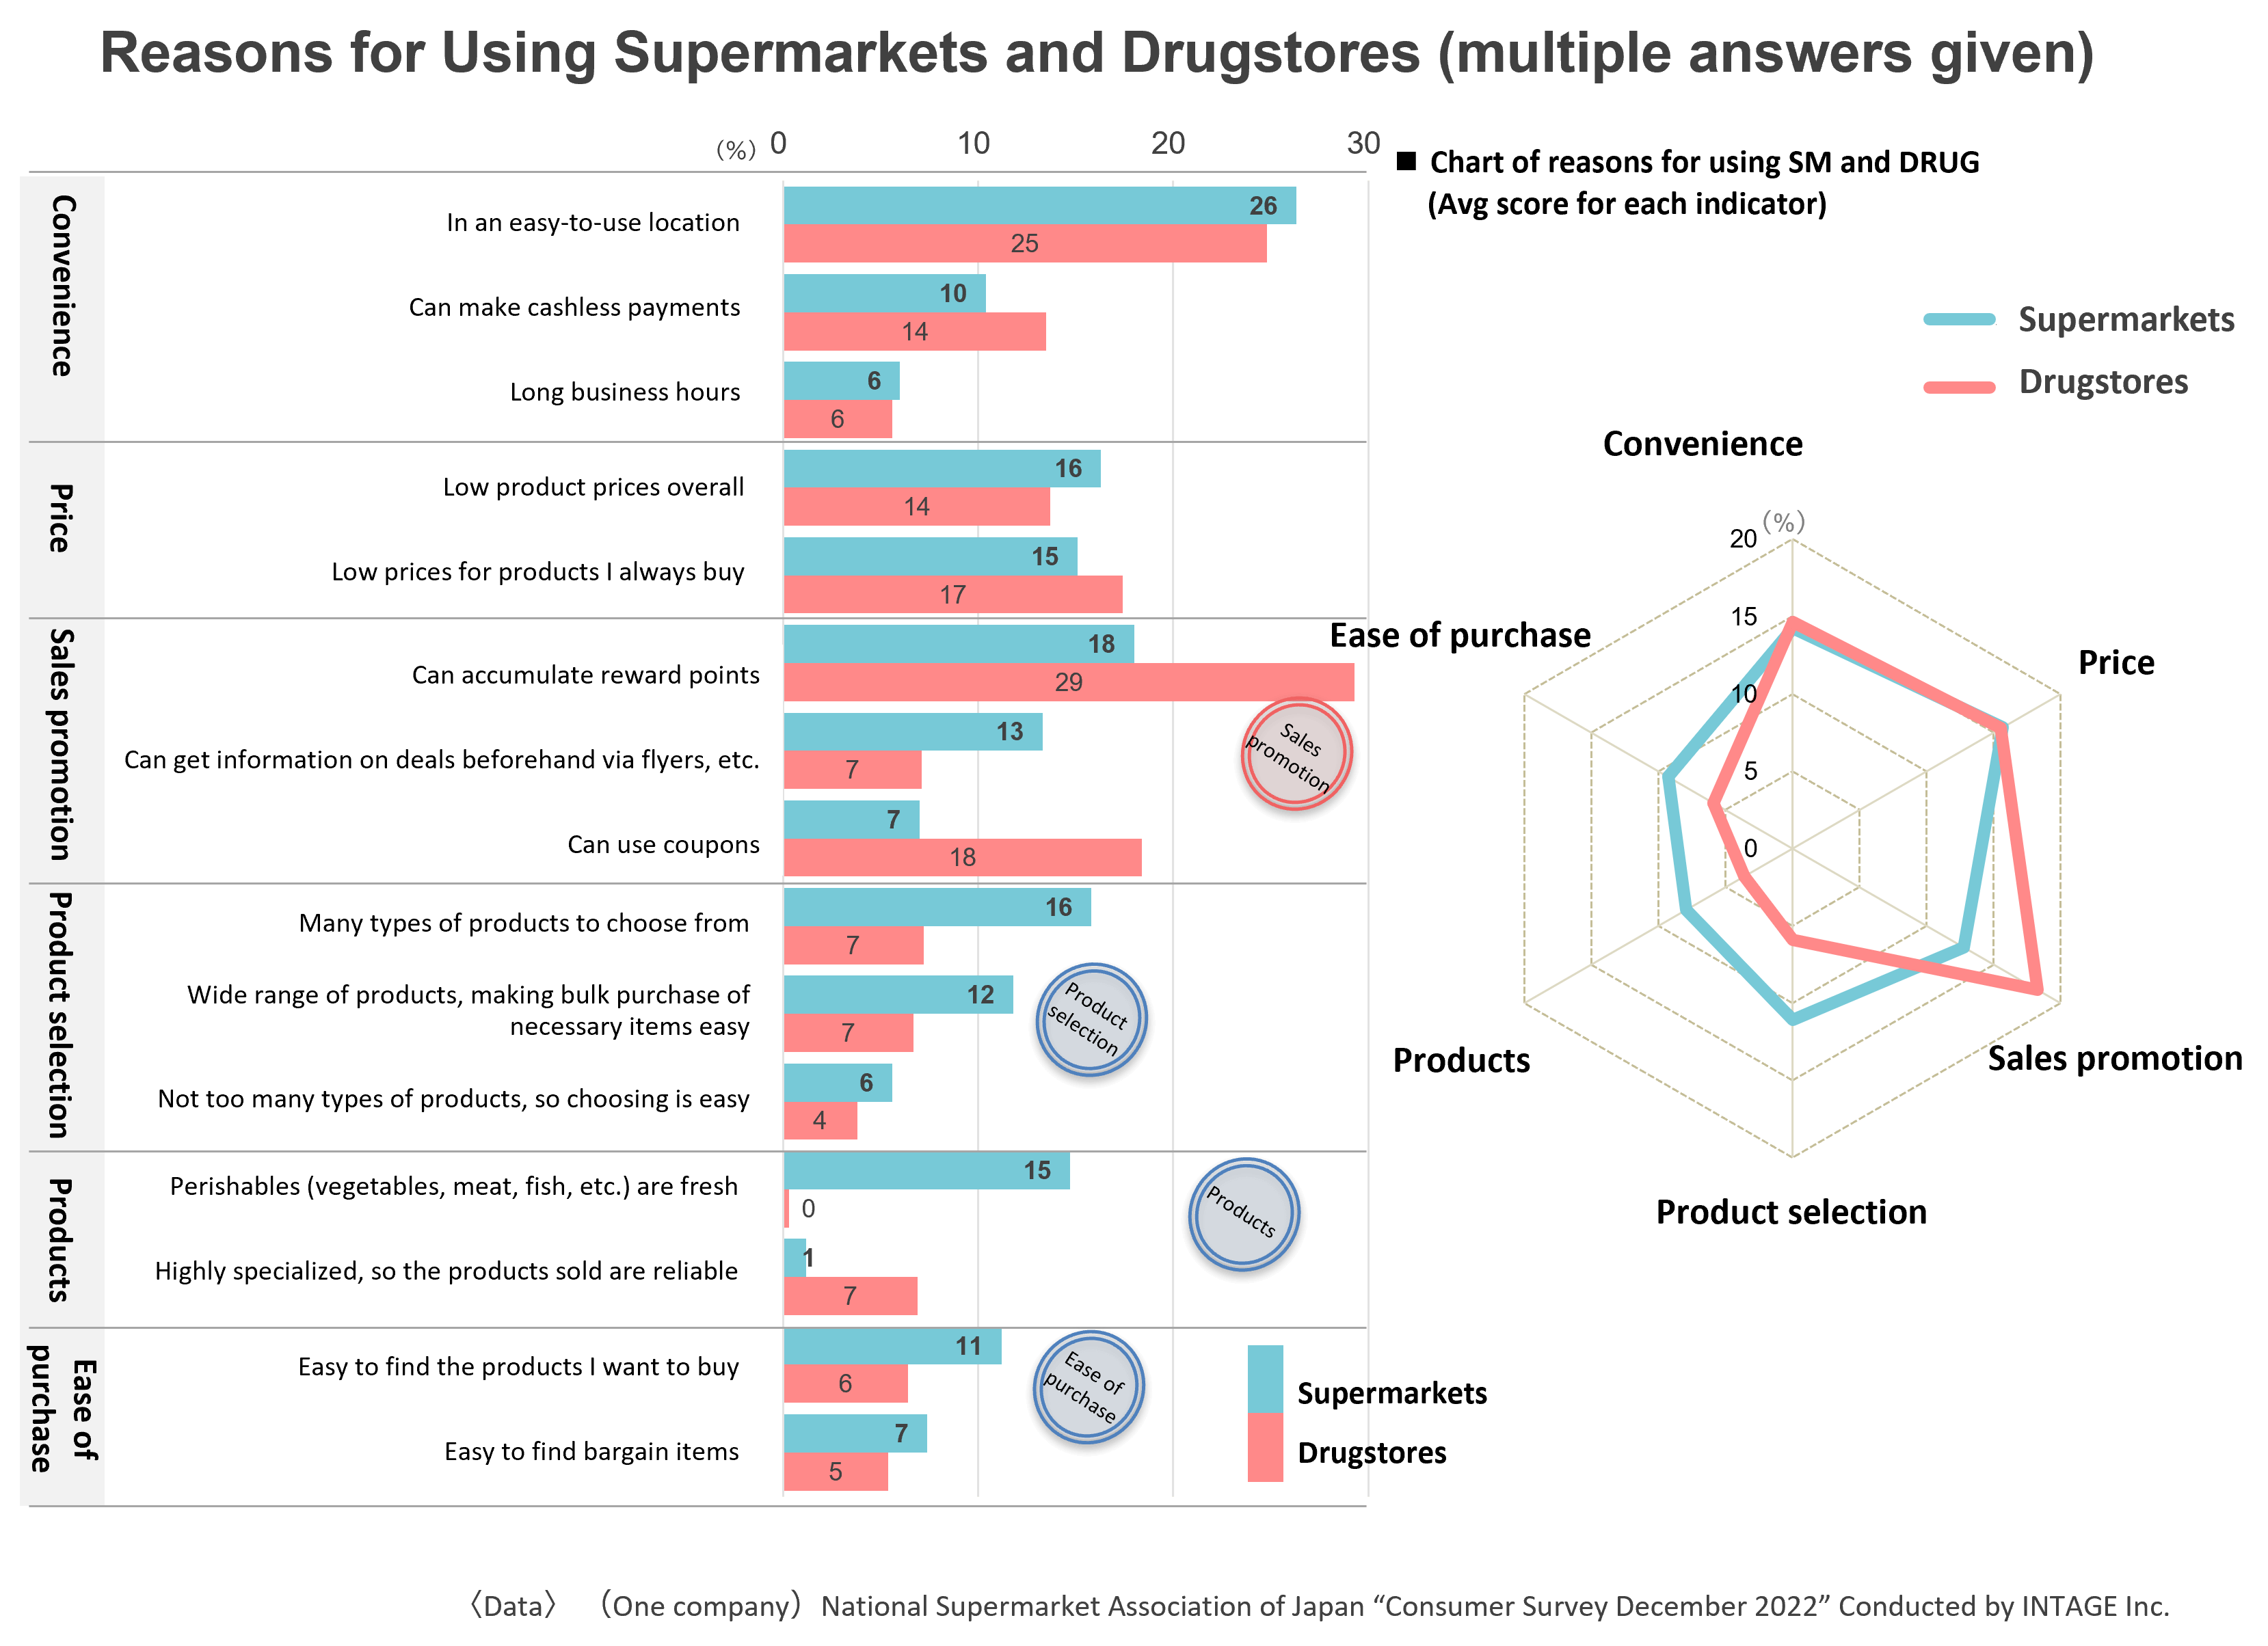
Let’s take a look at the findings of a survey conducted in December 2022 to see how consumers use supermarkets and drugstores differently. With regard to products, the “Freshness of perishables” was a major reason for using supermarkets, while “Specialty products” was given as a reason for using drugstores. As for sales promotion activities, “Flyers” are given as a reason for using supermarkets, while “Coupons and points” are given more commonly for drugstores. Posters and signs advertising “bonus reward point” days are a common sight at major drugstore chains, and on these days the stores are more crowded than usual. It also common to see shoppers’ baskets stuffed with items that they are probably stocking up on in order to take advantage of this opportunity to get extra points.
Moreover, “Wide selection” is more likely to be given as a point of attraction for supermarkets than it is for drugstores. As for “Price”, which is probably the most influential factor for shoppers, there are no major differences between the two channels, but “Low prices overall” is given at a higher rate for supermarkets, while “Low prices for products I always buy” is given at a higher rate for drugstores, highlighting the fact that perceptions of low prices as a point of attraction can vary depending on the channel. (Fig.7)
Fig.7
4. In Conclusion
Finally, to close the second installment of this series, I would like to present some interesting data.
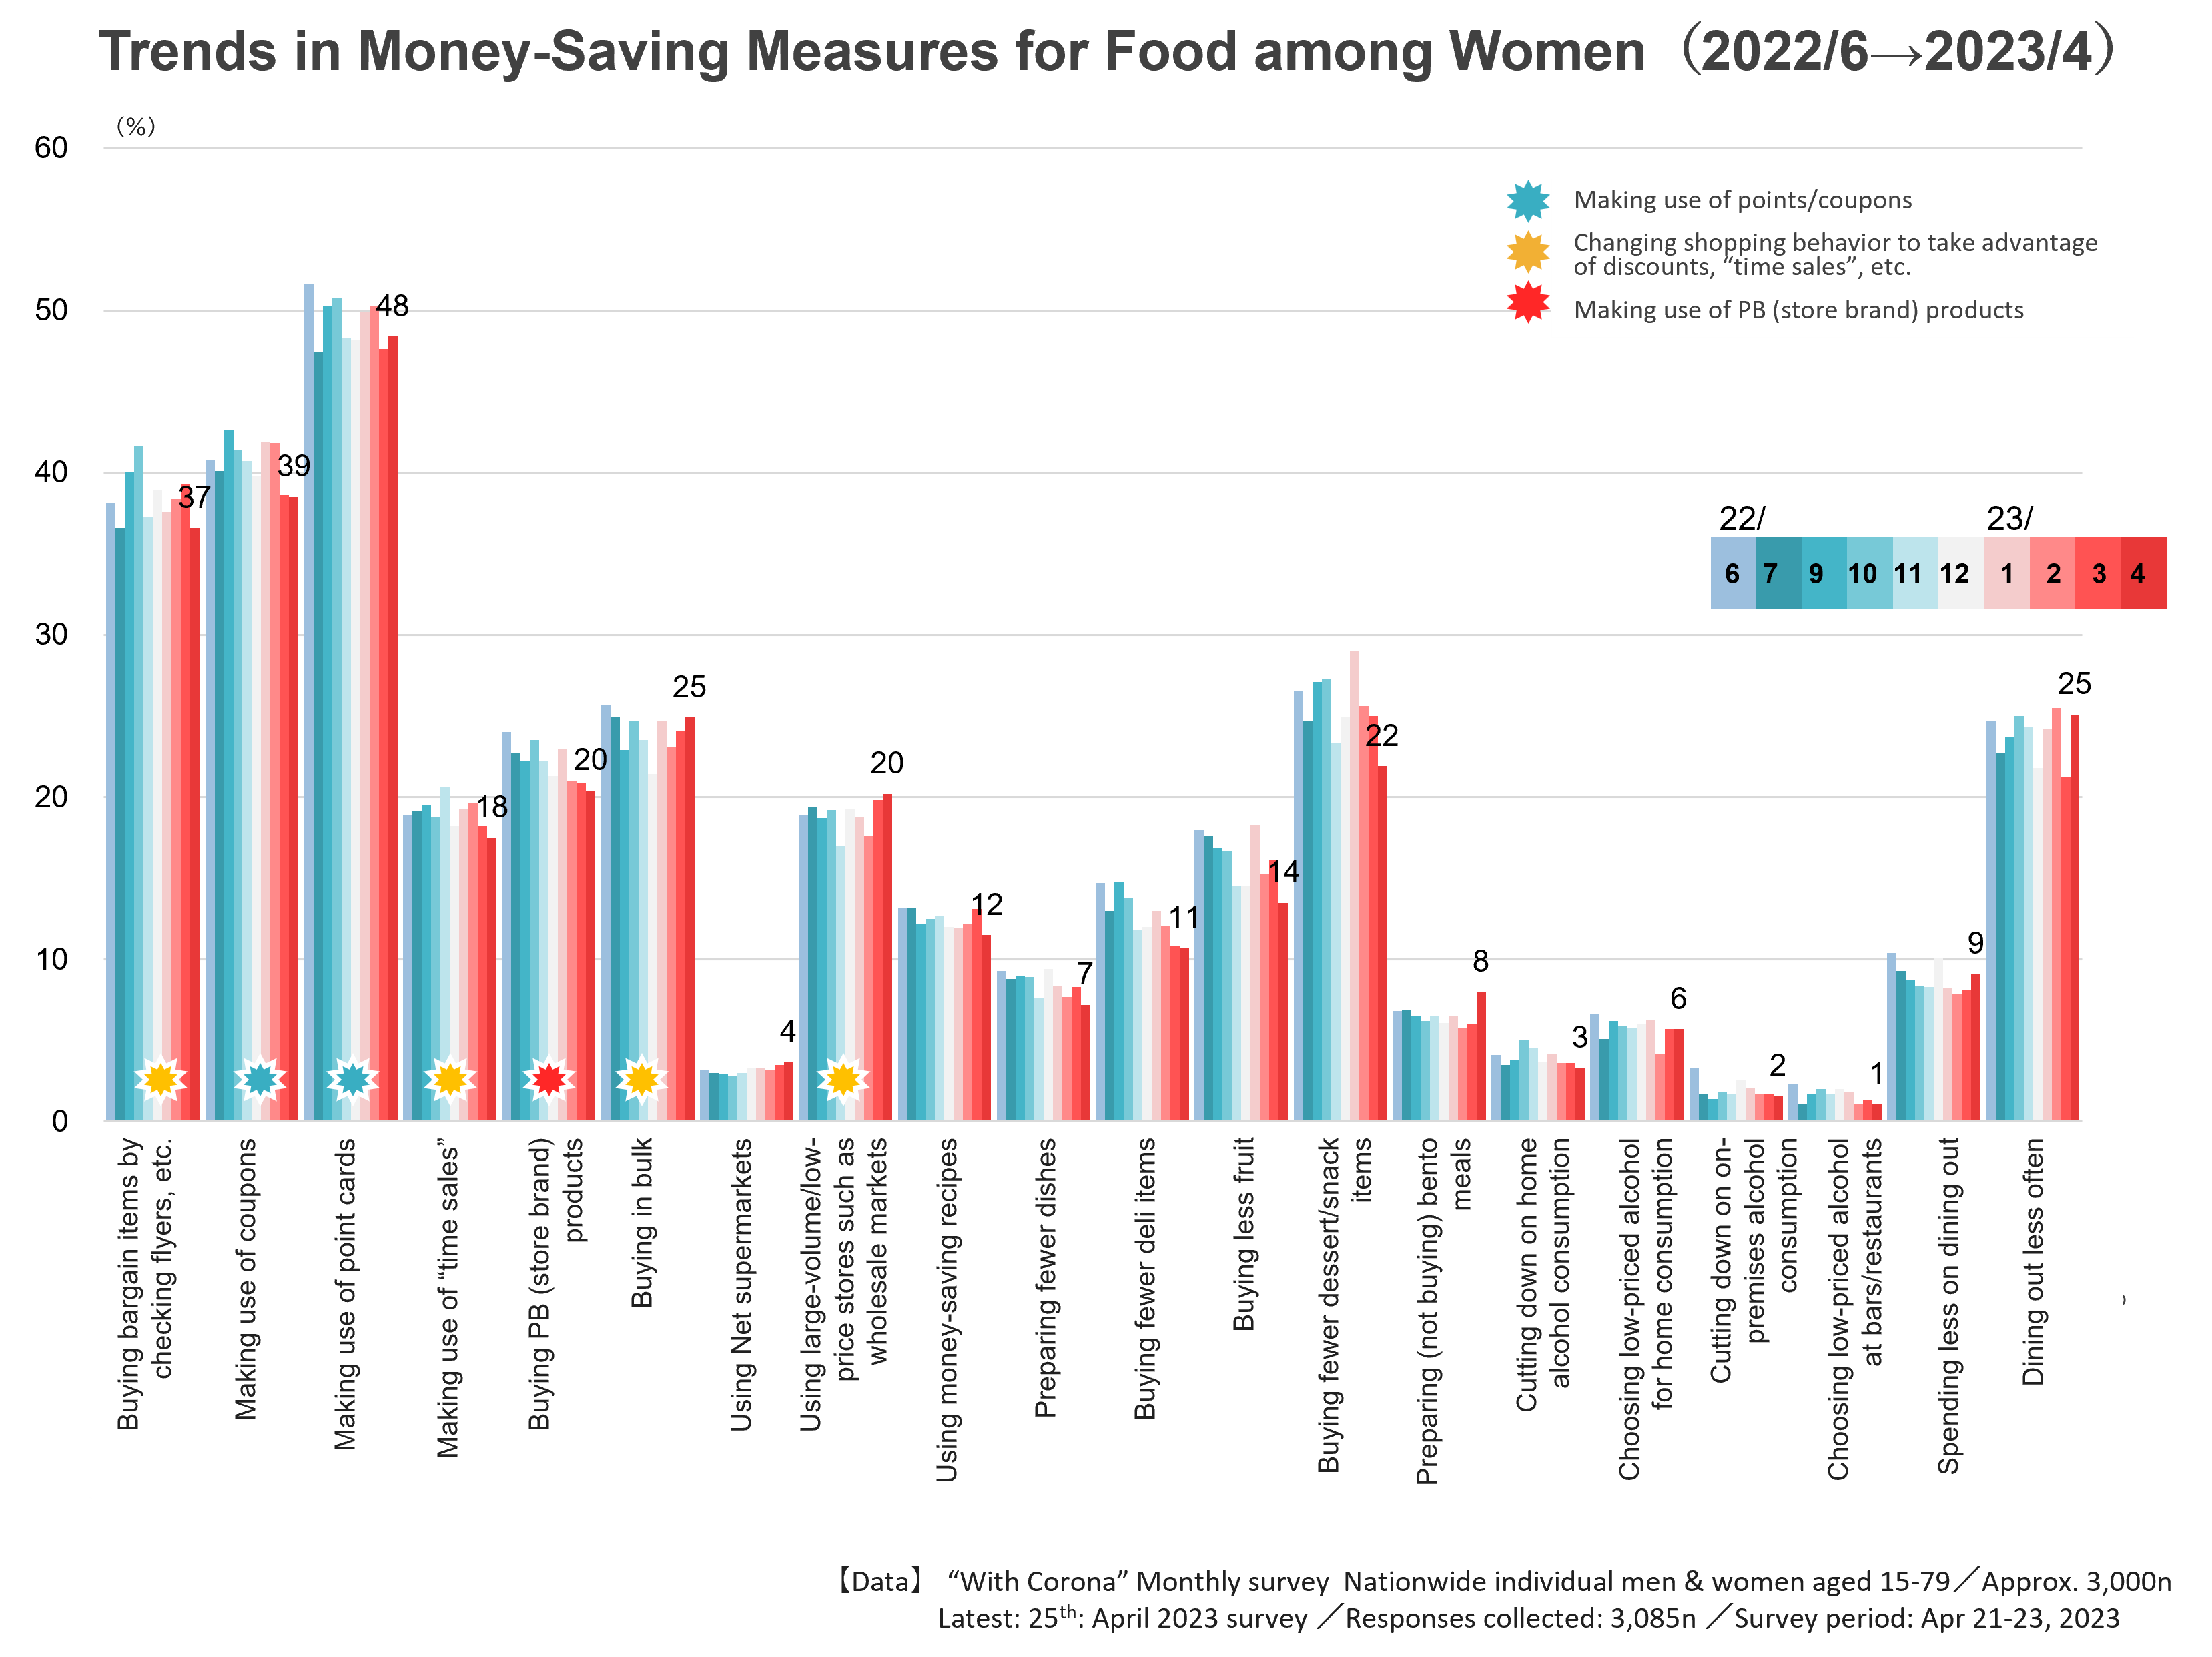
In one of our regularly conducted surveys, we asked the question, “With the price of various food items rising, what measures are you taking when purchasing groceries?” and the most common response was “Making use of point cards”. This has remained the top measure taken since June 2022, when we started including this question. This was followed by “Coupons” and “Flyers”, and as noted above, “Coupons” are also given as a reason for using drugstores. Another noteworthy measure adopted by shoppers is “Buying in bulk”. (Fig.8)
Fig.8
At first glance, one might imagine that the outflow to drugstores was due to a preference for low prices, but we found that the two channels are very close in terms of price. Supermarkets, however, are rated highly for their “Low prices overall”, while drugstores are favored for offering “Low prices for products I always buy”. The above findings bring to mind an image of consumers who, when purchasing products they always buy, make use of reward points or coupons and buy items in bulk at drugstores when they can get the best deals.
In my own home, I sometimes find our cupboards suddenly stocked with large quantities of instant noodles, laundry detergent, shampoo, and other items that were no doubt bought at the drugstore to take advantage of bonus point opportunities. I imagine that this is probably the case in many other households as well.
In the early stages of the pandemic, belt-tightening was caused by economic uncertainty and concerns about household finances, but now, it is the rising prices of goods and services that are driving people to cut down on expenses and adopt a variety of money-saving measures. The differentiated use of supermarkets and drugstores is one such measure. This article focused on the growth of drugstores, but supermarkets are also seen to have an attractive selection of fresh perishables and other products, including a full range of store brand products that contribute to low overall prices. Coupons and reward points are also likely to become as much of a strength for supermarkets as they are for drugstores.
What new scenes are you seeing in your daily life? For my part, I will be looking for new scenes as I ride my road bike along the Tamagawa River, enjoying the breeze and peeking into supermarkets and drugstores along the way.
Hiromasa Tanaka, Director, Consumer Research Center
Joined advertising agency-affiliated research firm in 1992. Participated as a founding member with a consumer database for the parent company advertising agency from 1994. From then until 2012, he was stationed in the advertising agency’s consumer research and advertising communication planning section, where he supported projects based on data-based consumer understanding in advertising communication planning and product/service development. During this time, he was responsible for a variety of areas, including FMCGs, DCGs, and services.
Fascinated by TV commercial footage and copy since his teens, he used to just record commercials and play them back time and again. If he had to choose some memorable ads, he would unhesitatingly give “1983 Suntory Royal Rambo ad (ad agency: Dentsu)” and “2004: Nescafe Shuntaro Tanikawa Morning Relay Sky ad (ad agency: McCann Erickson”. His hobbies include bicycling (road and mountain biking) and watching
Reproduction and Quotation
◆This report is copyrighted by INTAGE Inc. Please check the following prohibitions and precautions, and specify the source when reproducing or quoting this report. “Source: INTAGE “Knowledge Gallery” article published MM/DD/YYYY article”
◆The following are prohibited: ・Alteration of this article in full or in part ・Sale or publication of this article in full or in part ・Uses that are against public order and morality, and uses connected with illegal activities ・Reproducing or quoting panel data* for the purpose of advertising or promoting companies, products, or services *Panel data include: SRI+, SCI, SLI, Kitchen Diary, Car-kit, MAT-kit, Media Gauge, i-SSP, etc.
◆Other precautions: ・INTAGE Inc. shall not be liable for any trouble, loss, or damage caused by the use of this report ・These usage rules do not restrict the use of quotations or other uses permitted under the Copyright Act of Japan
◆For inquiries about reproduction and quotation, click here