How far has consumers’ digital shift progressed? Consumers and media now
In line with changes with media and consumer behavior, the relationship between media and consumers is changing surprisingly quickly compared to a decade ago. In order to respond to this change and continue to communicate appropriately with consumers, an ongoing grasp of changes in media and consumers is thus likely to be important.
This article excerpts some of the content of our “Media Life Report”, which ascertains changes in media and consumers based on INTAGE proprietary media exposure log data and questionnaire surveys to summarize how consumers’ media use is changing.
First, let’s take a look at the use of devices for viewing media. Various media outlets had run features on “young people moving away from TV and shifting to digital media”, but what does the actual data show?
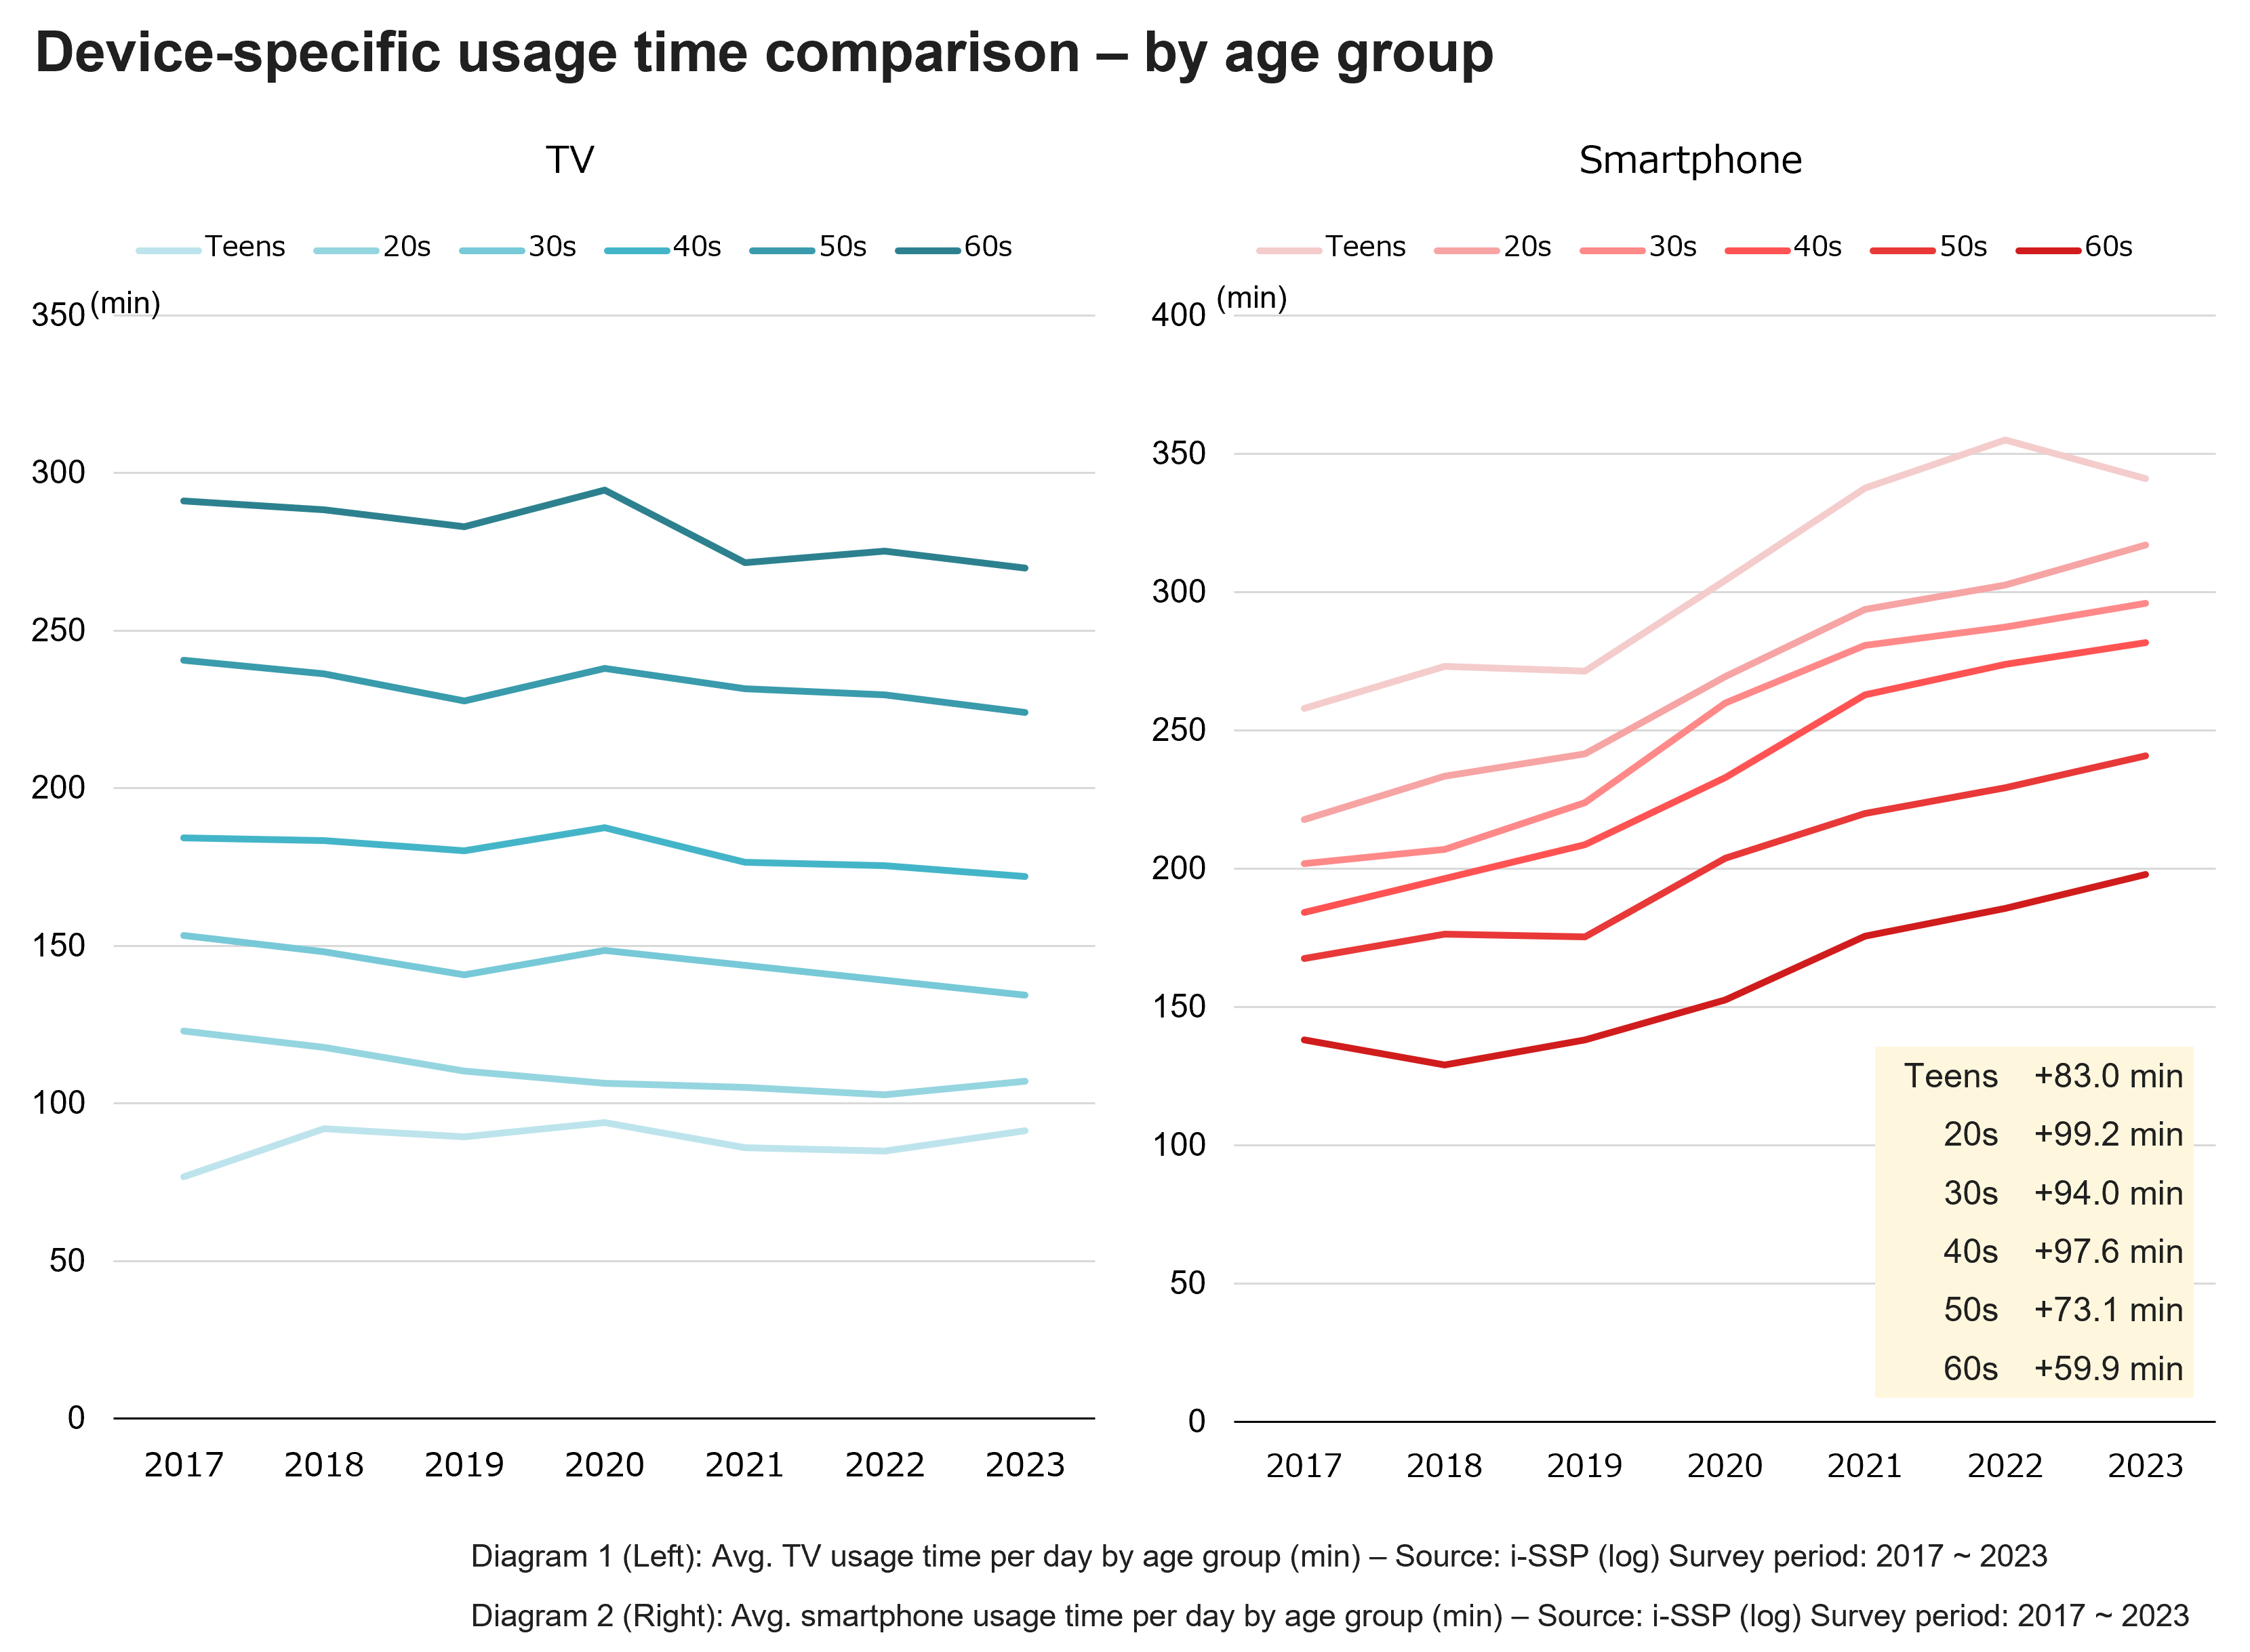
Fig.1 and 2 present the average TV and smartphone usage times per day by age group based on INTAGE proprietary i-SSP (INTAGE Single Source Panel) data.
Fig.1 / Fig.2
On observation of daily average usage time in 2023, it is clear that teens’ and those in their 20s’ TV usage time is shorter than that of other age groups at approximately 1 ~ 2 hours, while their smartphone usage time is longer at approximately 5 ~ 6 hours. Based on this, it is apparent that young people tend to be exposed to each kind of media through their smartphones rather than through the TV.
However, on observation of the changes from 2017, the largest decrease in daily average TV usage time is among those in their 60s, down 21.3 minutes. In addition, average TV usage time has decreased among all age groups other than teens. On observation of smartphones, the largest increase in daily average usage time is among those in their 20s, followed by those in their 40s, 30s, with those in their 50s and 60s also increasing by more than an hour.
In other words, while young people use TV for shorter lengths than other age groups and use smartphones for longer lengths, the move away from the TV and shift to digital media is occurring among all age groups, not just young people. The hypothesis that “young people moving away from TV and shifting to digital media is correct, although it can be said that it doesn’t paint the full picture.
2.Changes in viewing habits ① State of connected TV usage
Let’s next examine the state of connected TV usage. The use of connected TVs has accelerated recently due to the spread of TVs connected to the internet, and streaming devices that can connect to the internet simply through connecting via a TV.
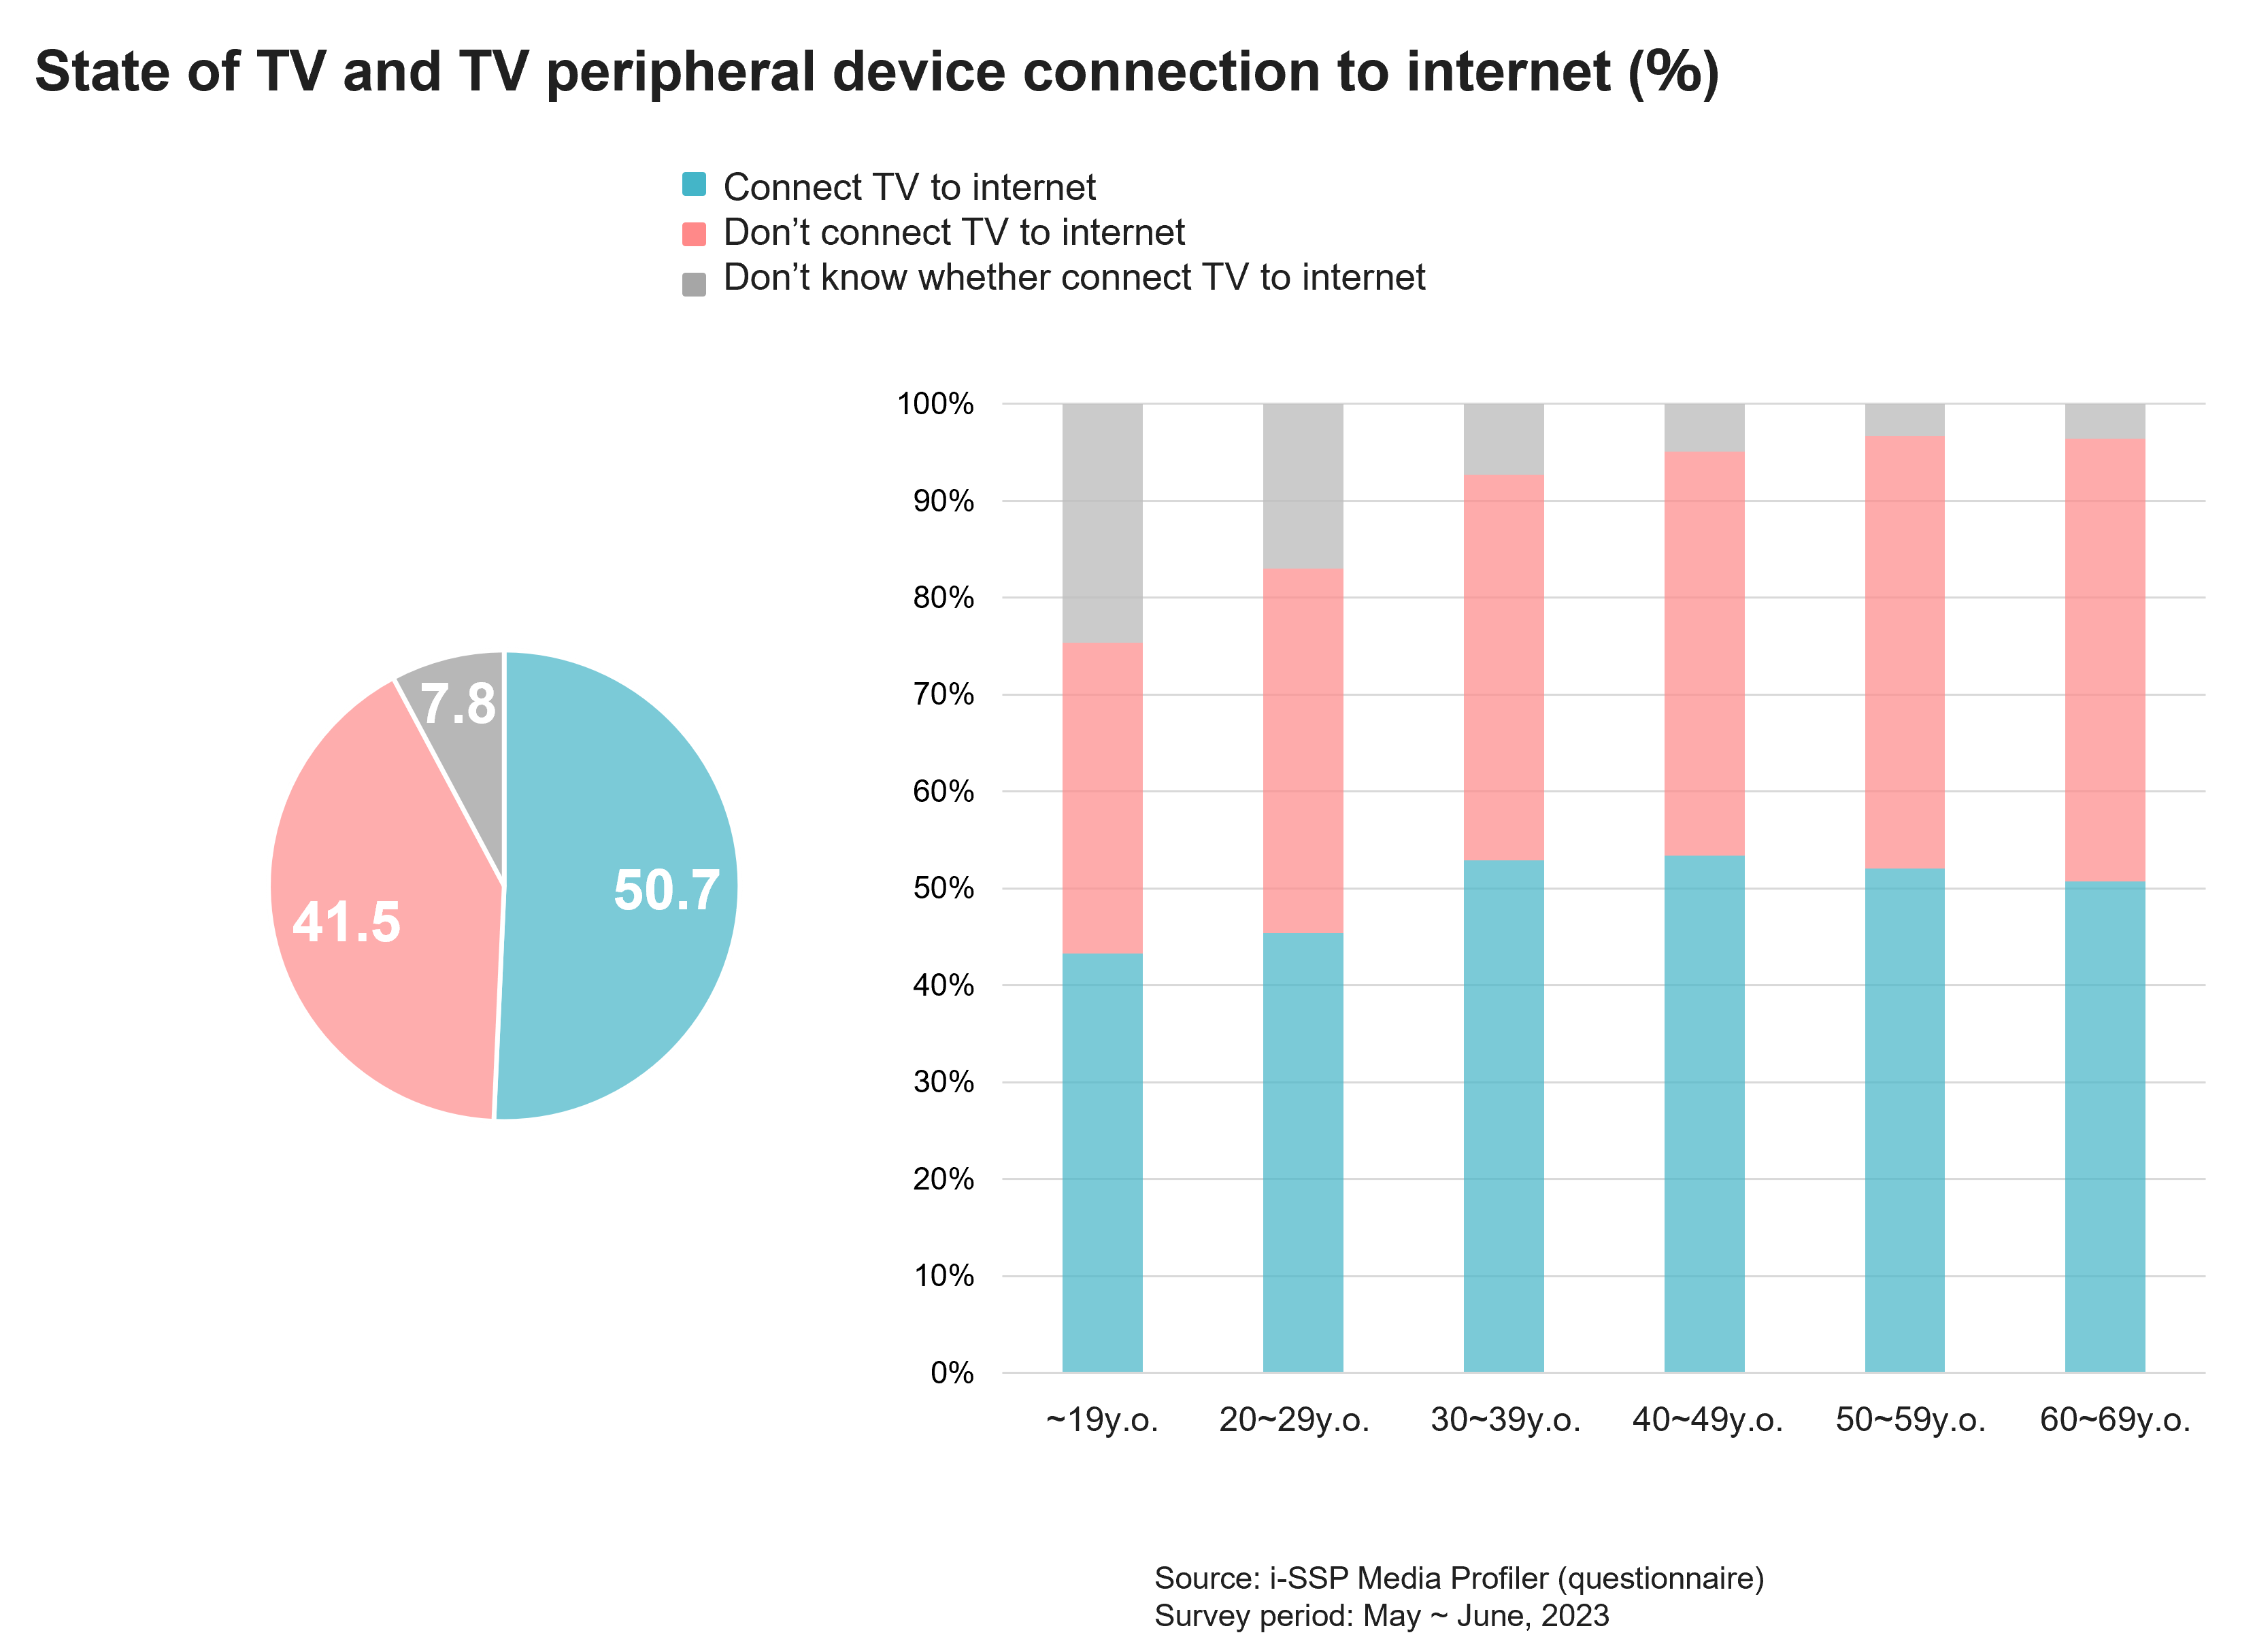
Fig.3 and 4 present the results of a questionnaire survey asking about the state of people’s TV internet connection with individuals who participate in the i-SSP surveys that we discussed a moment ago.
Fig.3 / Fig.4
On observation of this data, it is clear that as of 2023, approximately half of TVs are connected to the internet. In addition, these is virtually no difference by age group except for teens who are unlikely to be directly involved in the purchase of TVs and peripheral devices, so connected TVs can be said to be becoming more popular regardless of age.
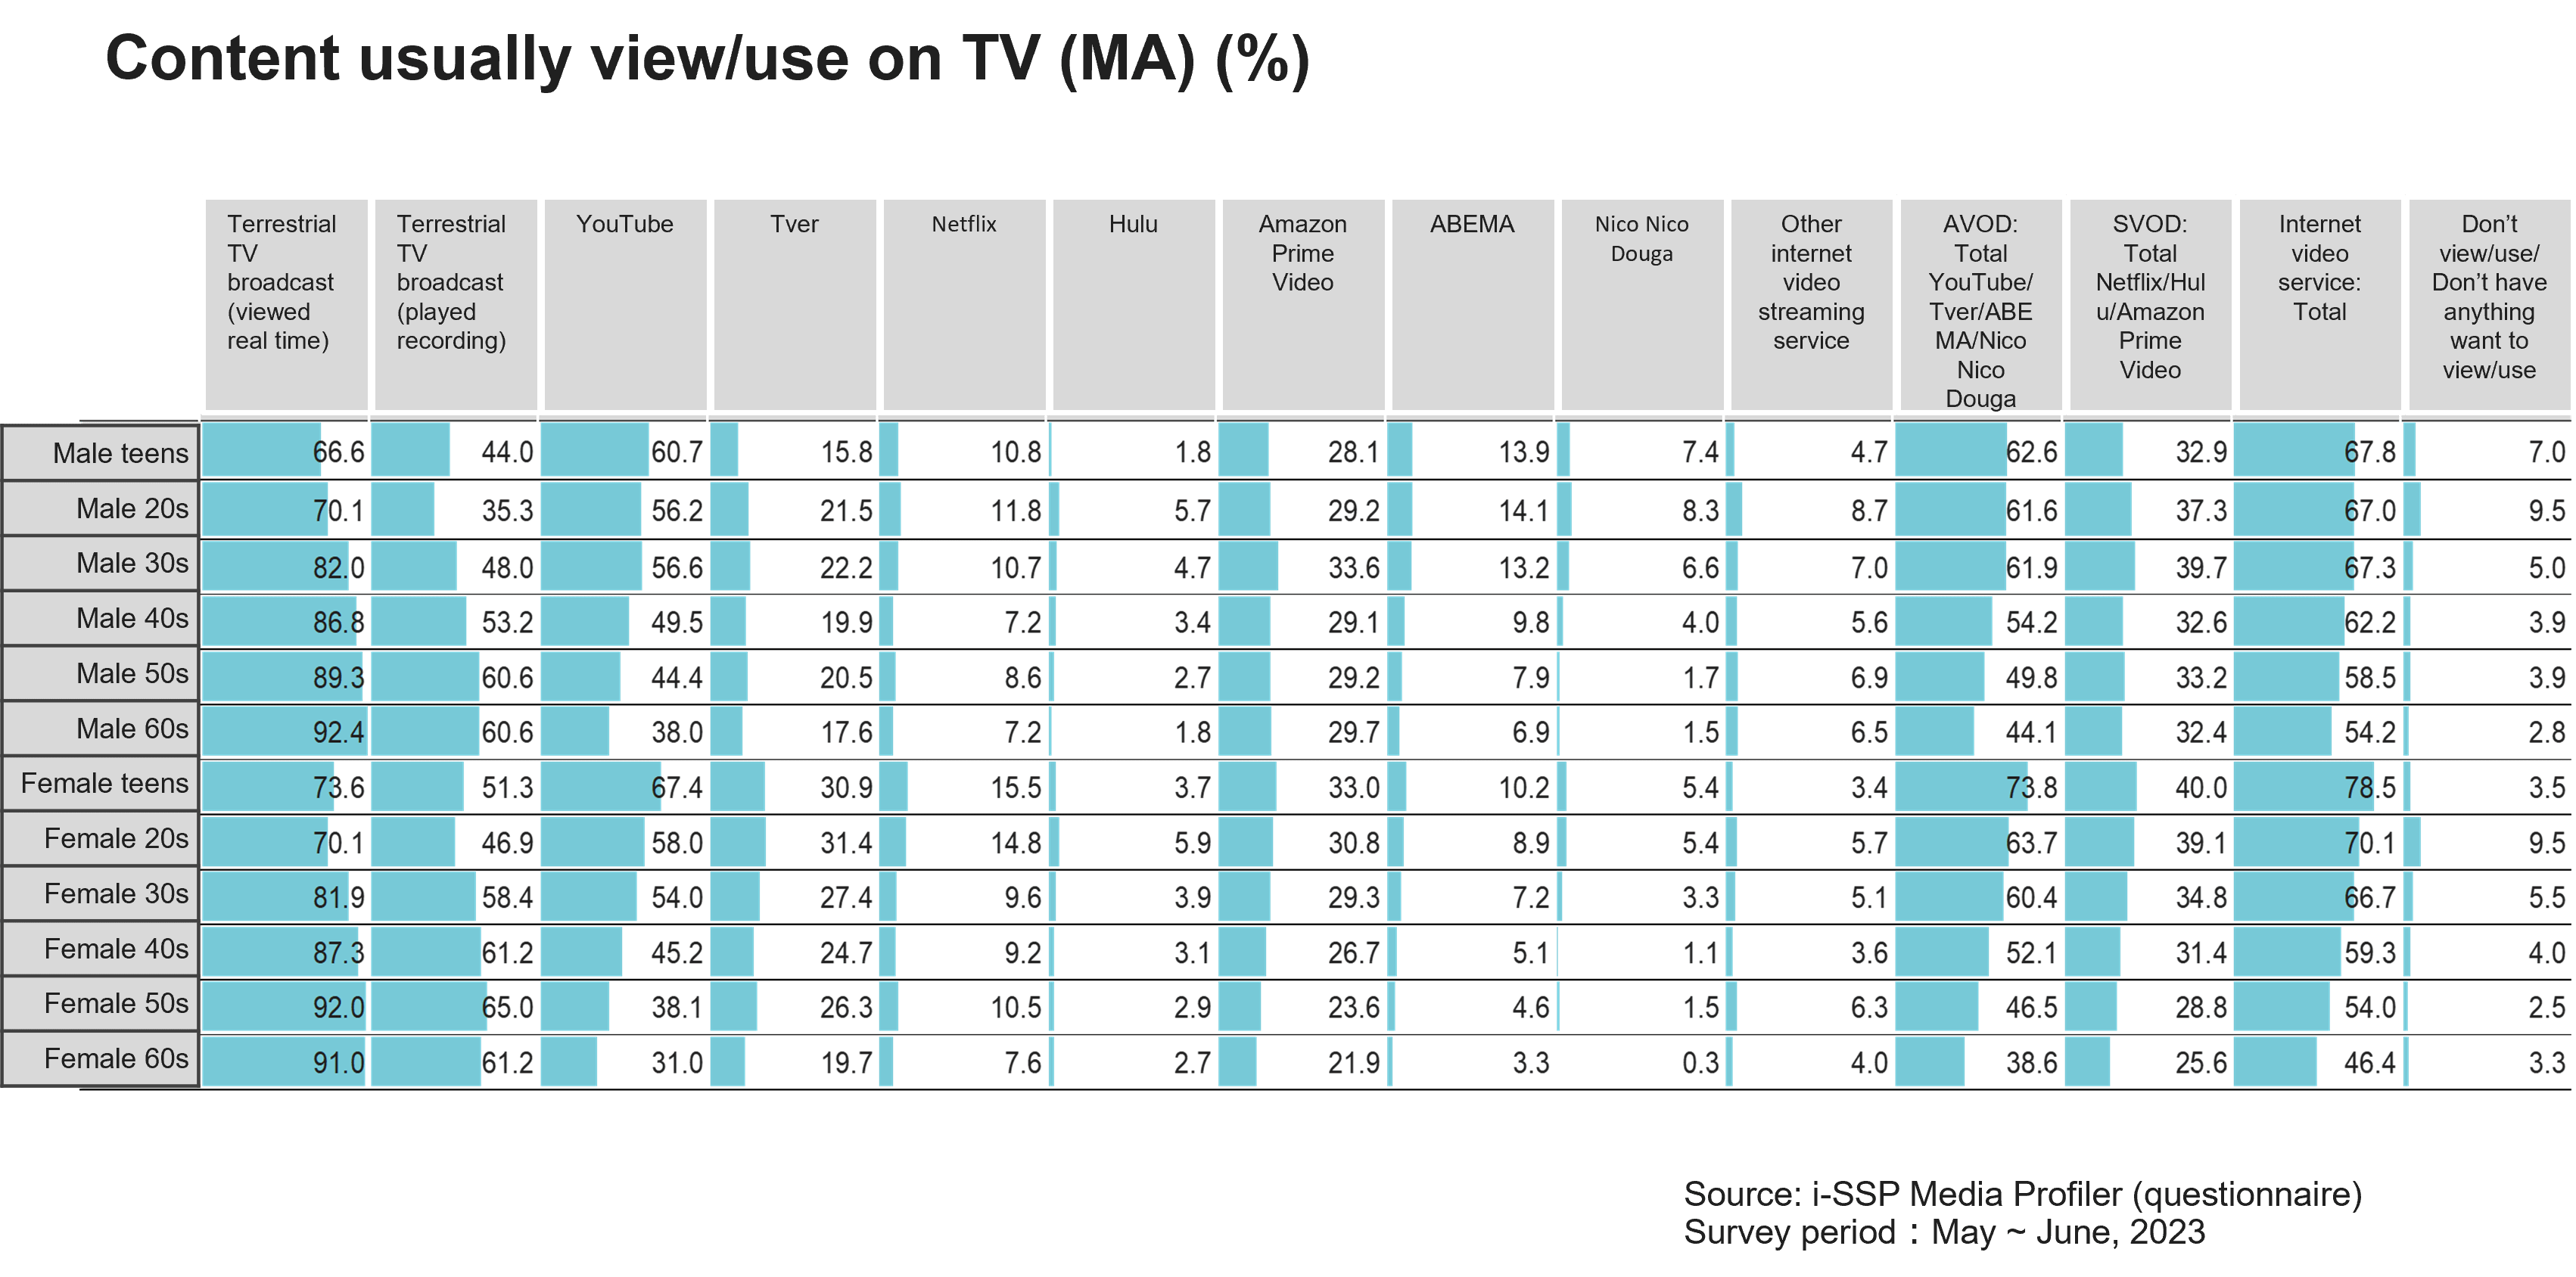
So how is each age group using these connected TVs? Fig.5 depicts content normally watched by gender and age group.
Fig.5
The higher the age group, the greater the proportion who watch conventional terrestrial TV broadcasts. While around 90% of those in their 50s and 60s watch “terrestrial TV broadcasts (watch them in real time)”, around 70% do so in their teens, a difference of around 20 points. YouTube is used by around 60% of those in their teens and 20s, yet by around 40% of those in their 50s and 60s, the converse trend to that seen with terrestrial TV broadcasts. Compared with seniors, young people can thus be said to have a strong tendency to use TV devices not “to watch broadcasts”, but “to watched streamed content”.
One point of note is that more than 45% of those in their 50s and 60s also use some kind of internet video service. Although young people display higher internet content usage rates on connected TVs, we need to keep in mind that seniors are also using TV to watch internet content as the content viewable on TV screens has increased and the number of options has grown.
Incidentally, on calculation of number of persons based on the universe’s population* and viewing rates of Internet video service total , the number of online content users via connected TVs in Japan is about 16.5 million people in their teens and 20s, and around 17.5 million people in their 50s and 60s, indicating more are in their 50s and 60s. These results suggest it may be necessary to consider approaches via digital media as well when formulating advertising communication measures targeted at seniors.
TVs still play a sizable role as devices for watching “TV broadcasts” on, but as connected TVs become more popular going forward, they will naturally become devices for watching “content” on in future.
3.Changes in viewing habits ②State of social media/video sharing service usage
Let’s next examine the state of social media and video streaming service usage.
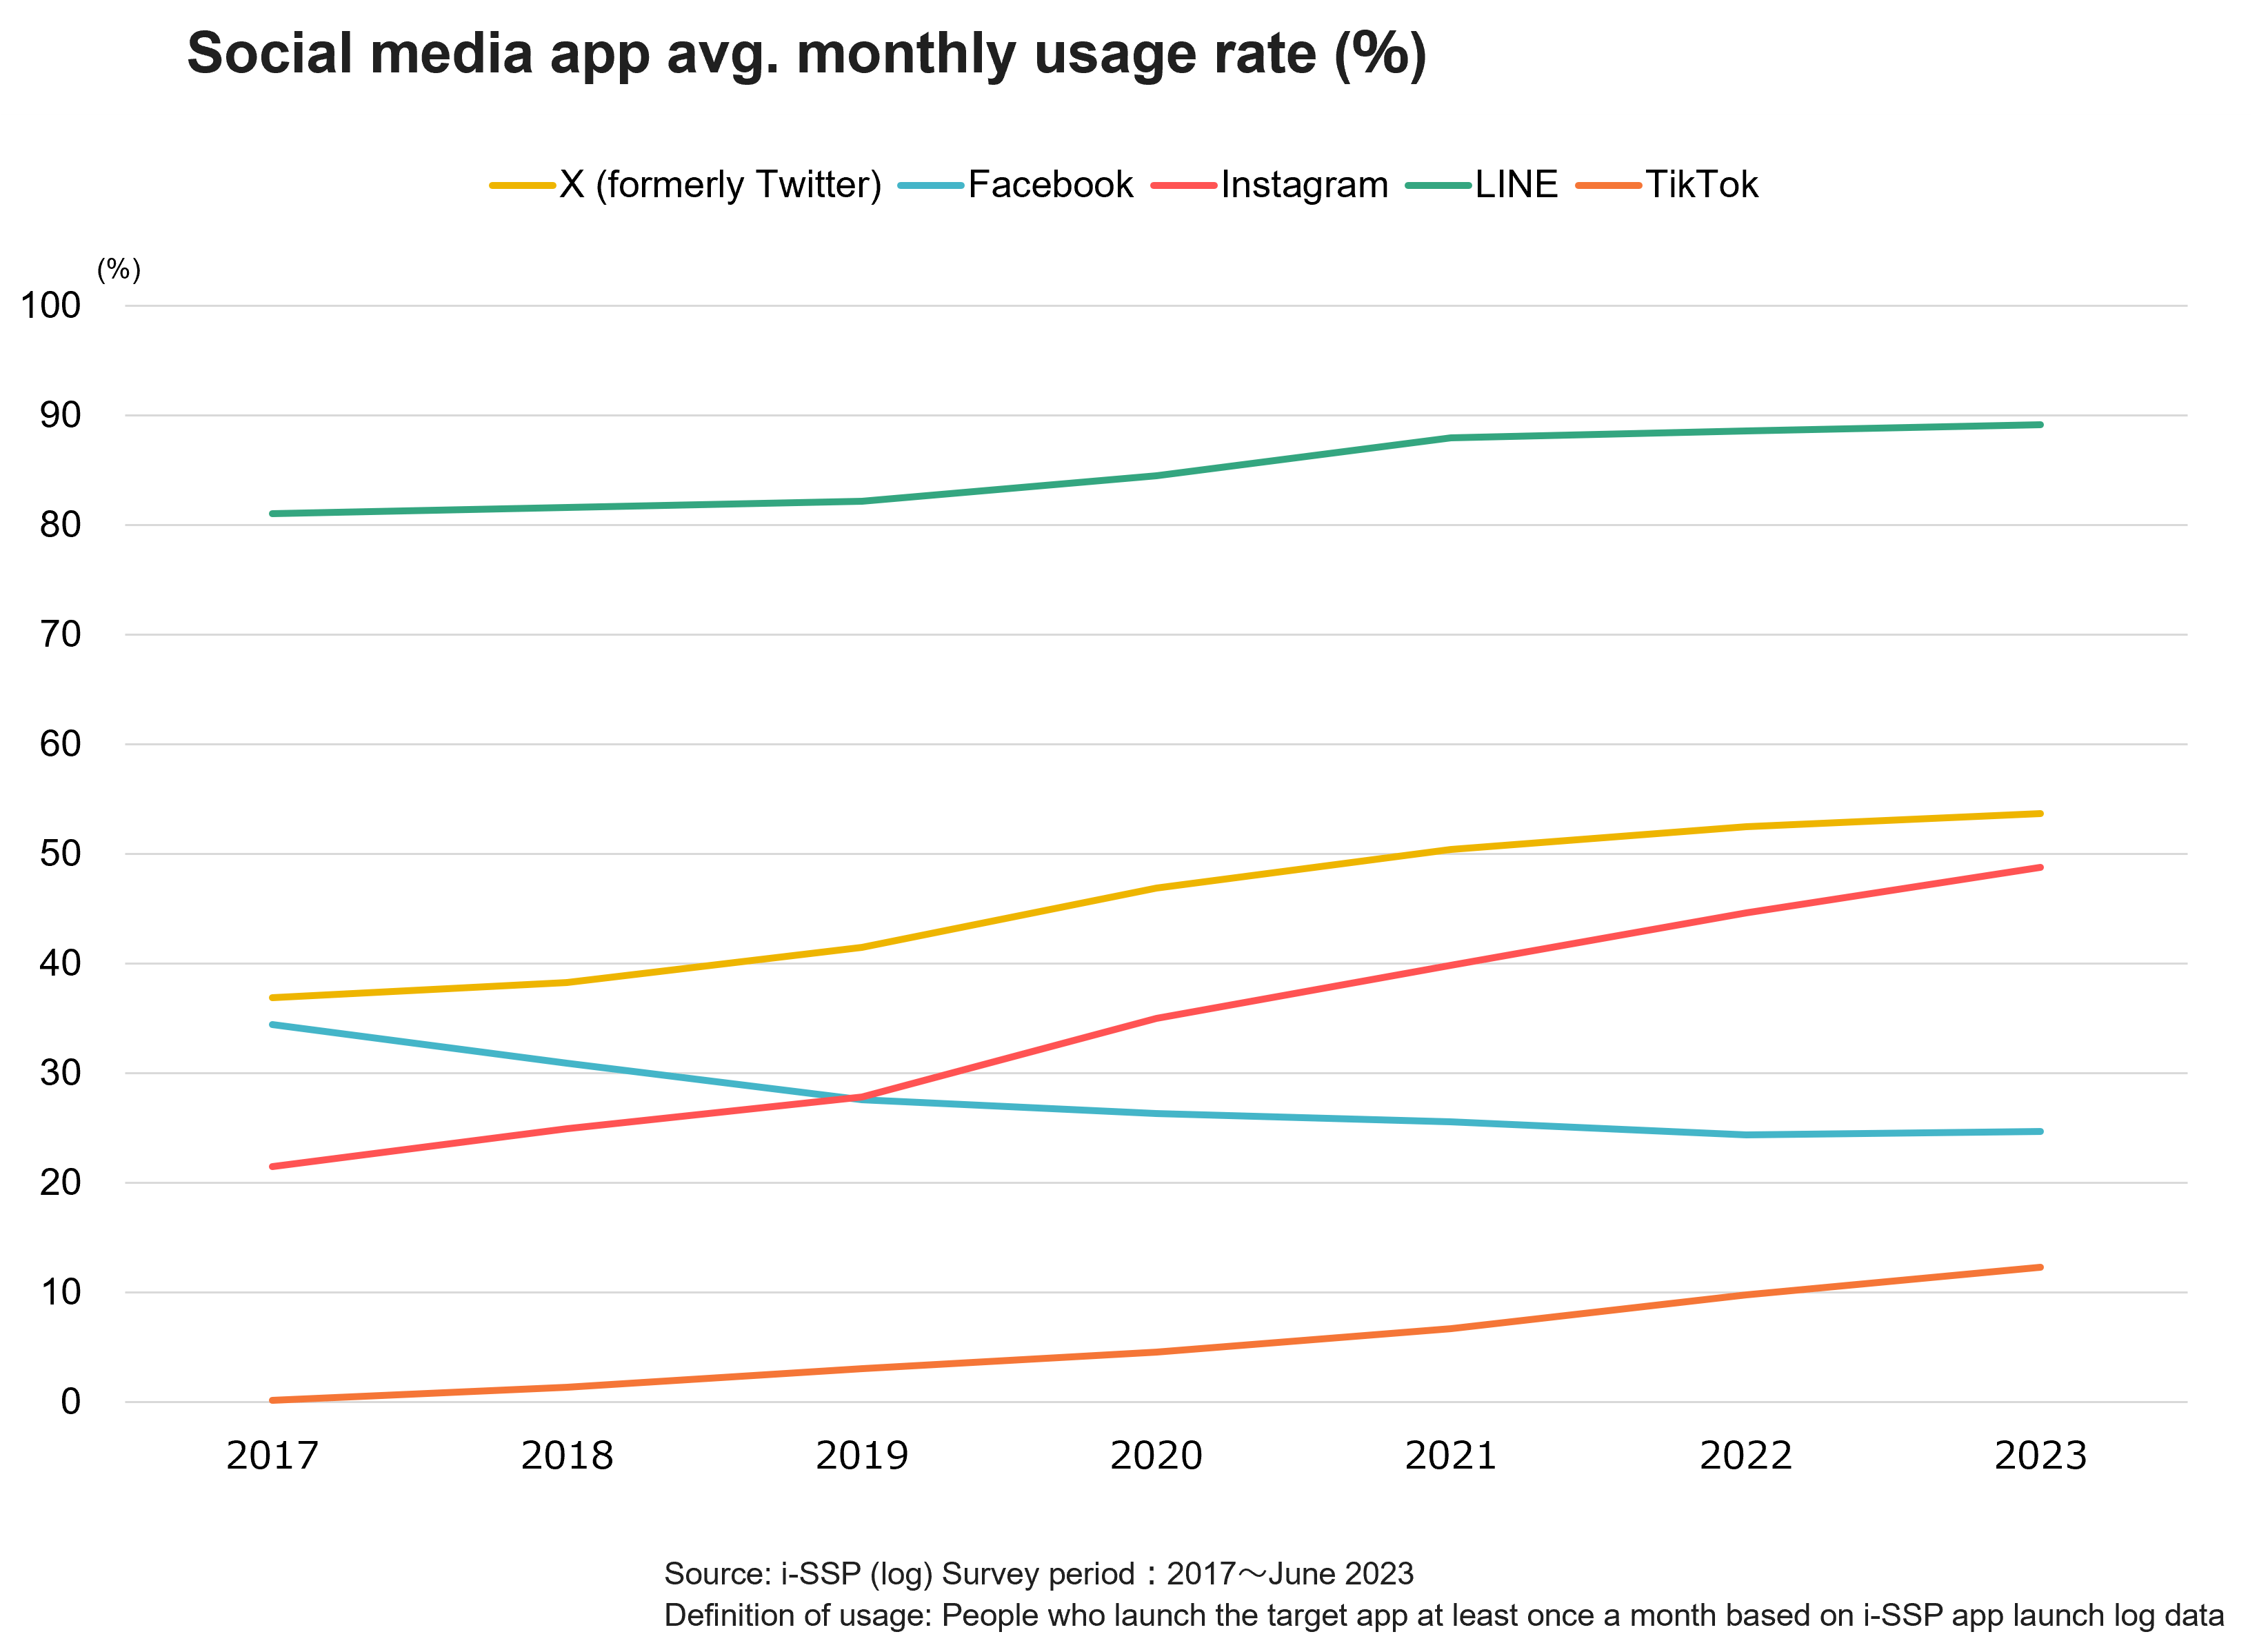
First up is social media. Fig.6 depicts shifts in monthly social media app usage rates since 2017.
Fig.6
Most recently in 2023, LINE had the highest usage rate, followed by X (formerly Twitter), Instagram, Facebook, and TikTok. Usage rates other than for Facebook are on an upward trend, with Instagram clearly overtaking Facebook in 2019. TikTok has recently been the focus of attention as an advertising medium due to the rapid increase in its number of users and high diffusion power. However, on observation from a monthly average usage rate perspective, it is apparent that there is still a gap between it and other media.
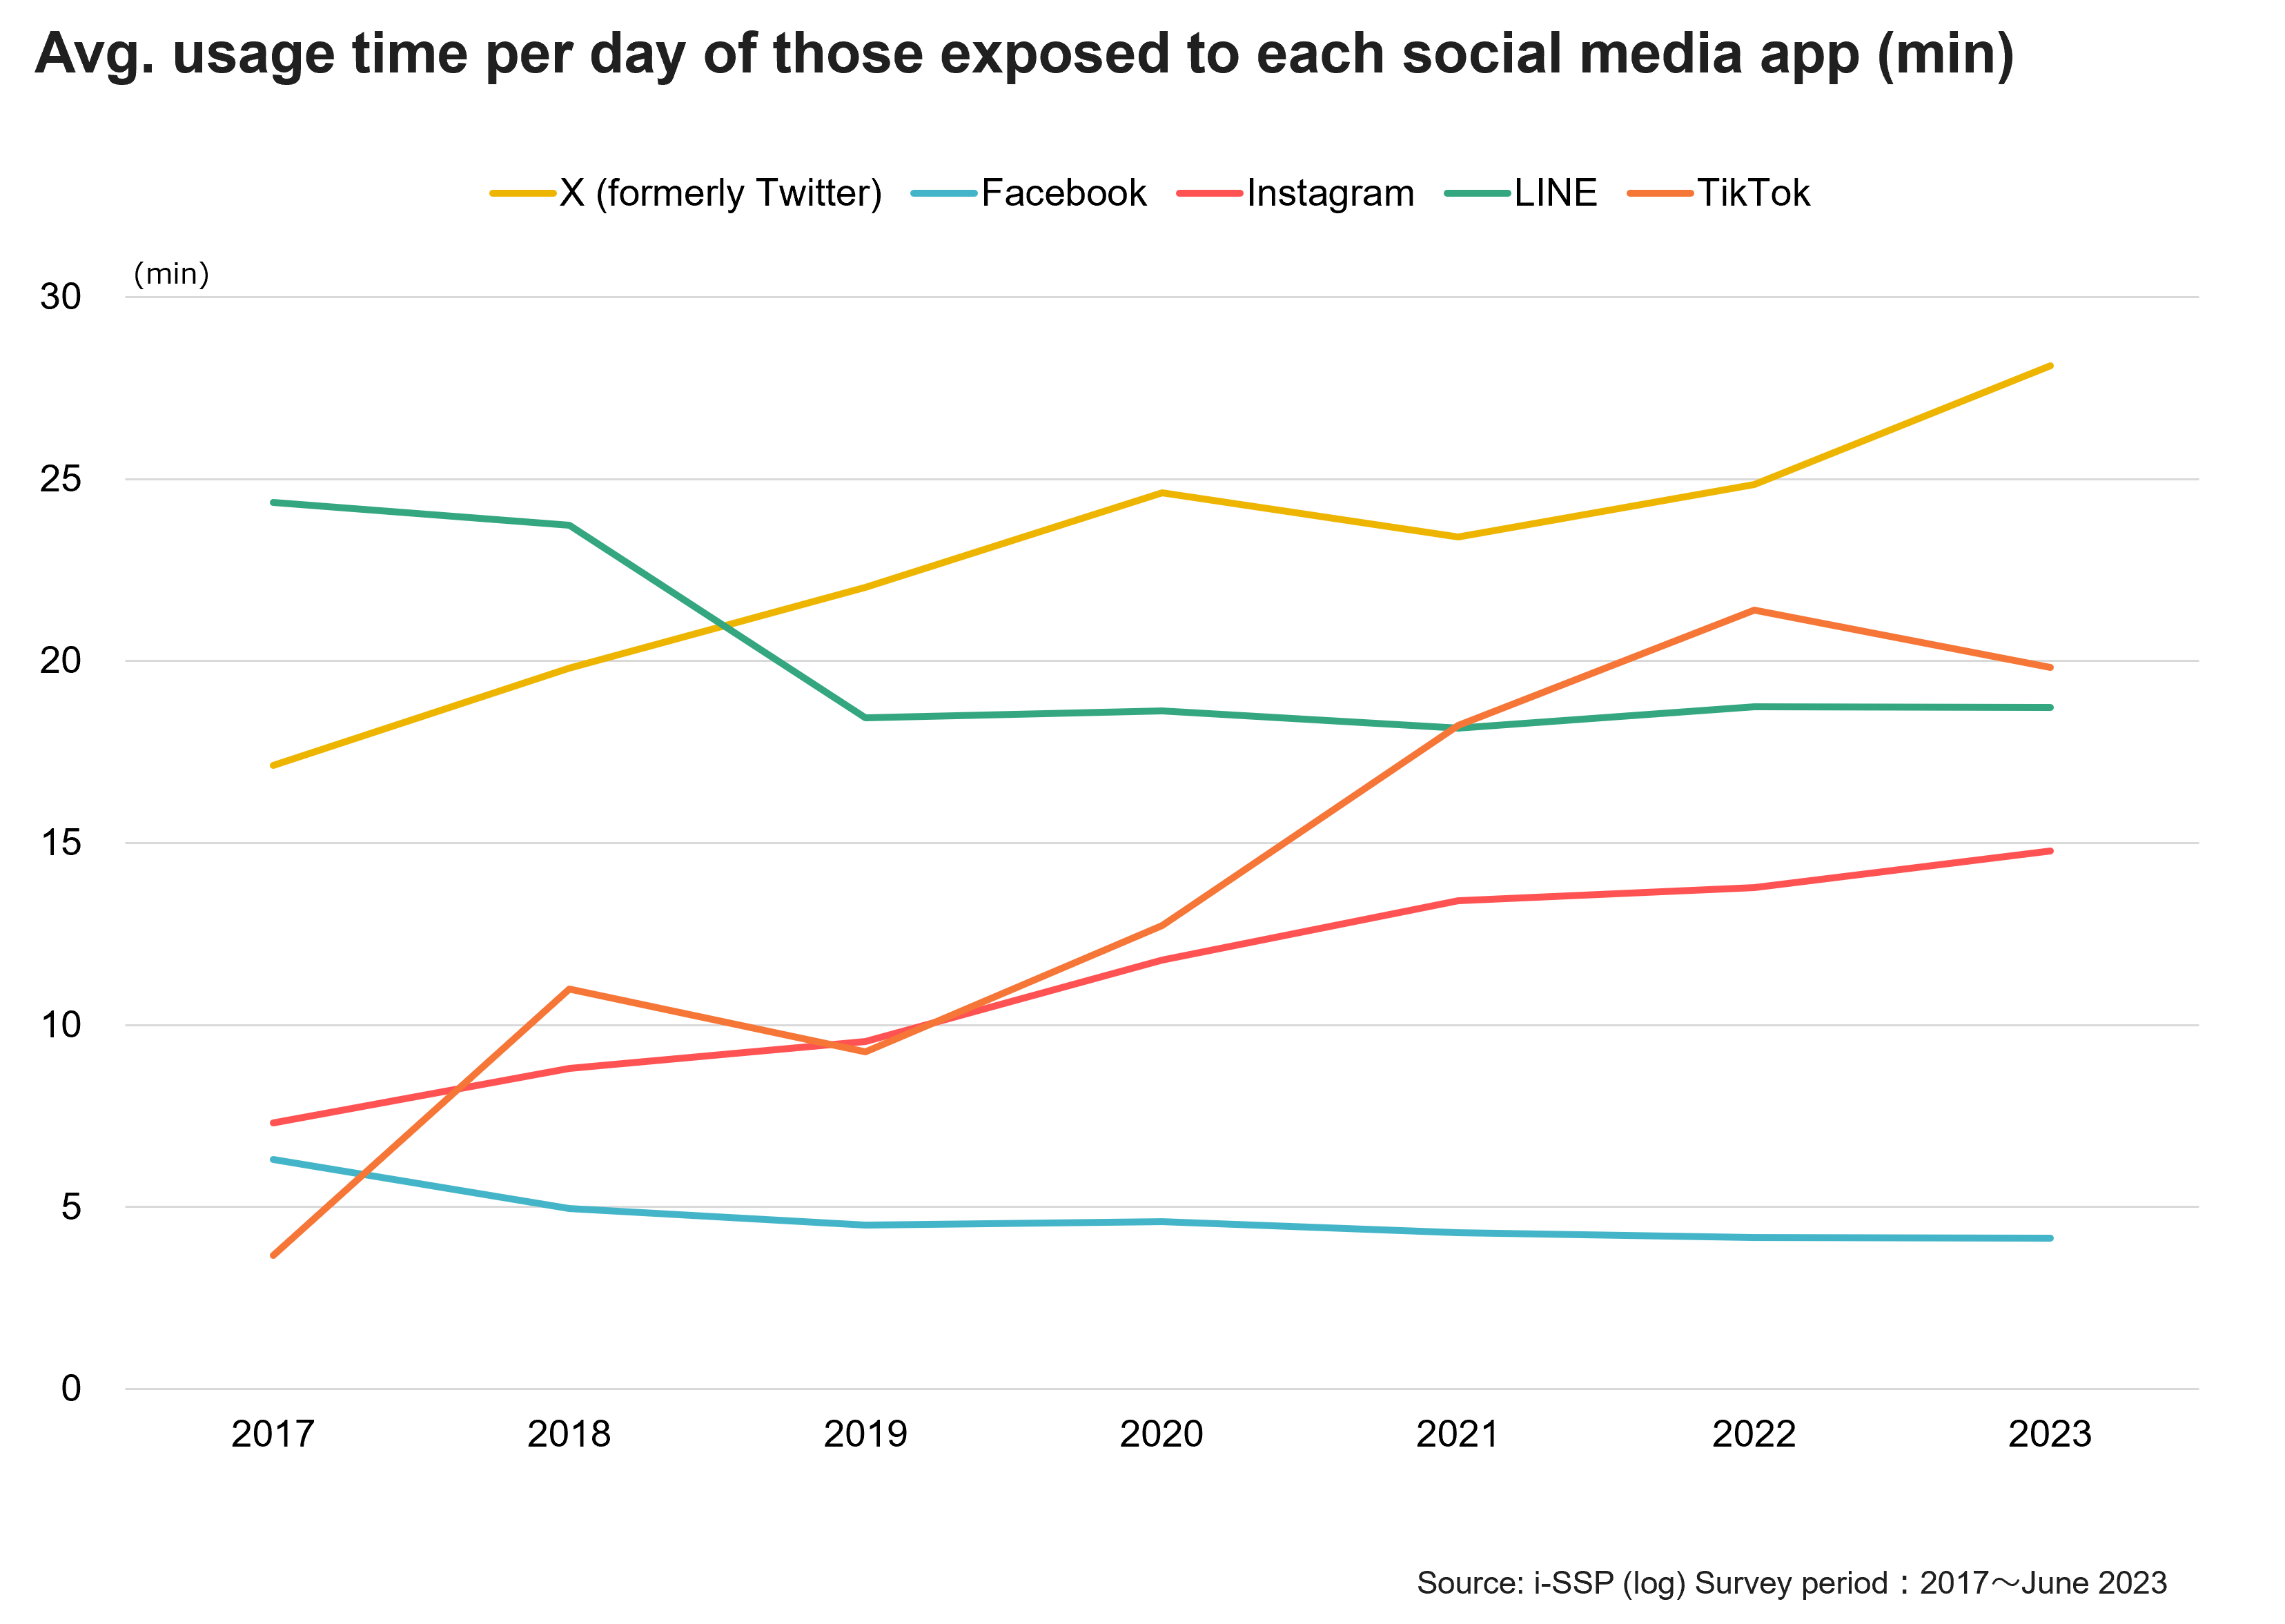
Next, Fig.7 depicts the daily usage time of users of each app.
Fig.7
Most recently in 2023, X (formerly Twitter) had the longest usage time, overtaking LINE in 2019. In addition, TikTok also overtook LINE from 2021 to 2022, becoming the second longest used social media in terms of usage time per user.
As such, LINE is often used as a means of communication among social media apps, and has the highest usage rate, but has shorter in-app time than some other social media apps. X (formerly Twitter) and TikTok conversely have longer in-app times than other social media apps due to the nature of their services where they are opened at scrolled through subconsciously rather than used/vided for a purpose, so it is likely in-app usage rates and usage frequency will increase with them.
Many people may have an intuitive grasp on these phenomena. However, actually clarifying this with data may be useful in putting stakeholders on the same page in terms of outlook, and in advertising communication decision making.
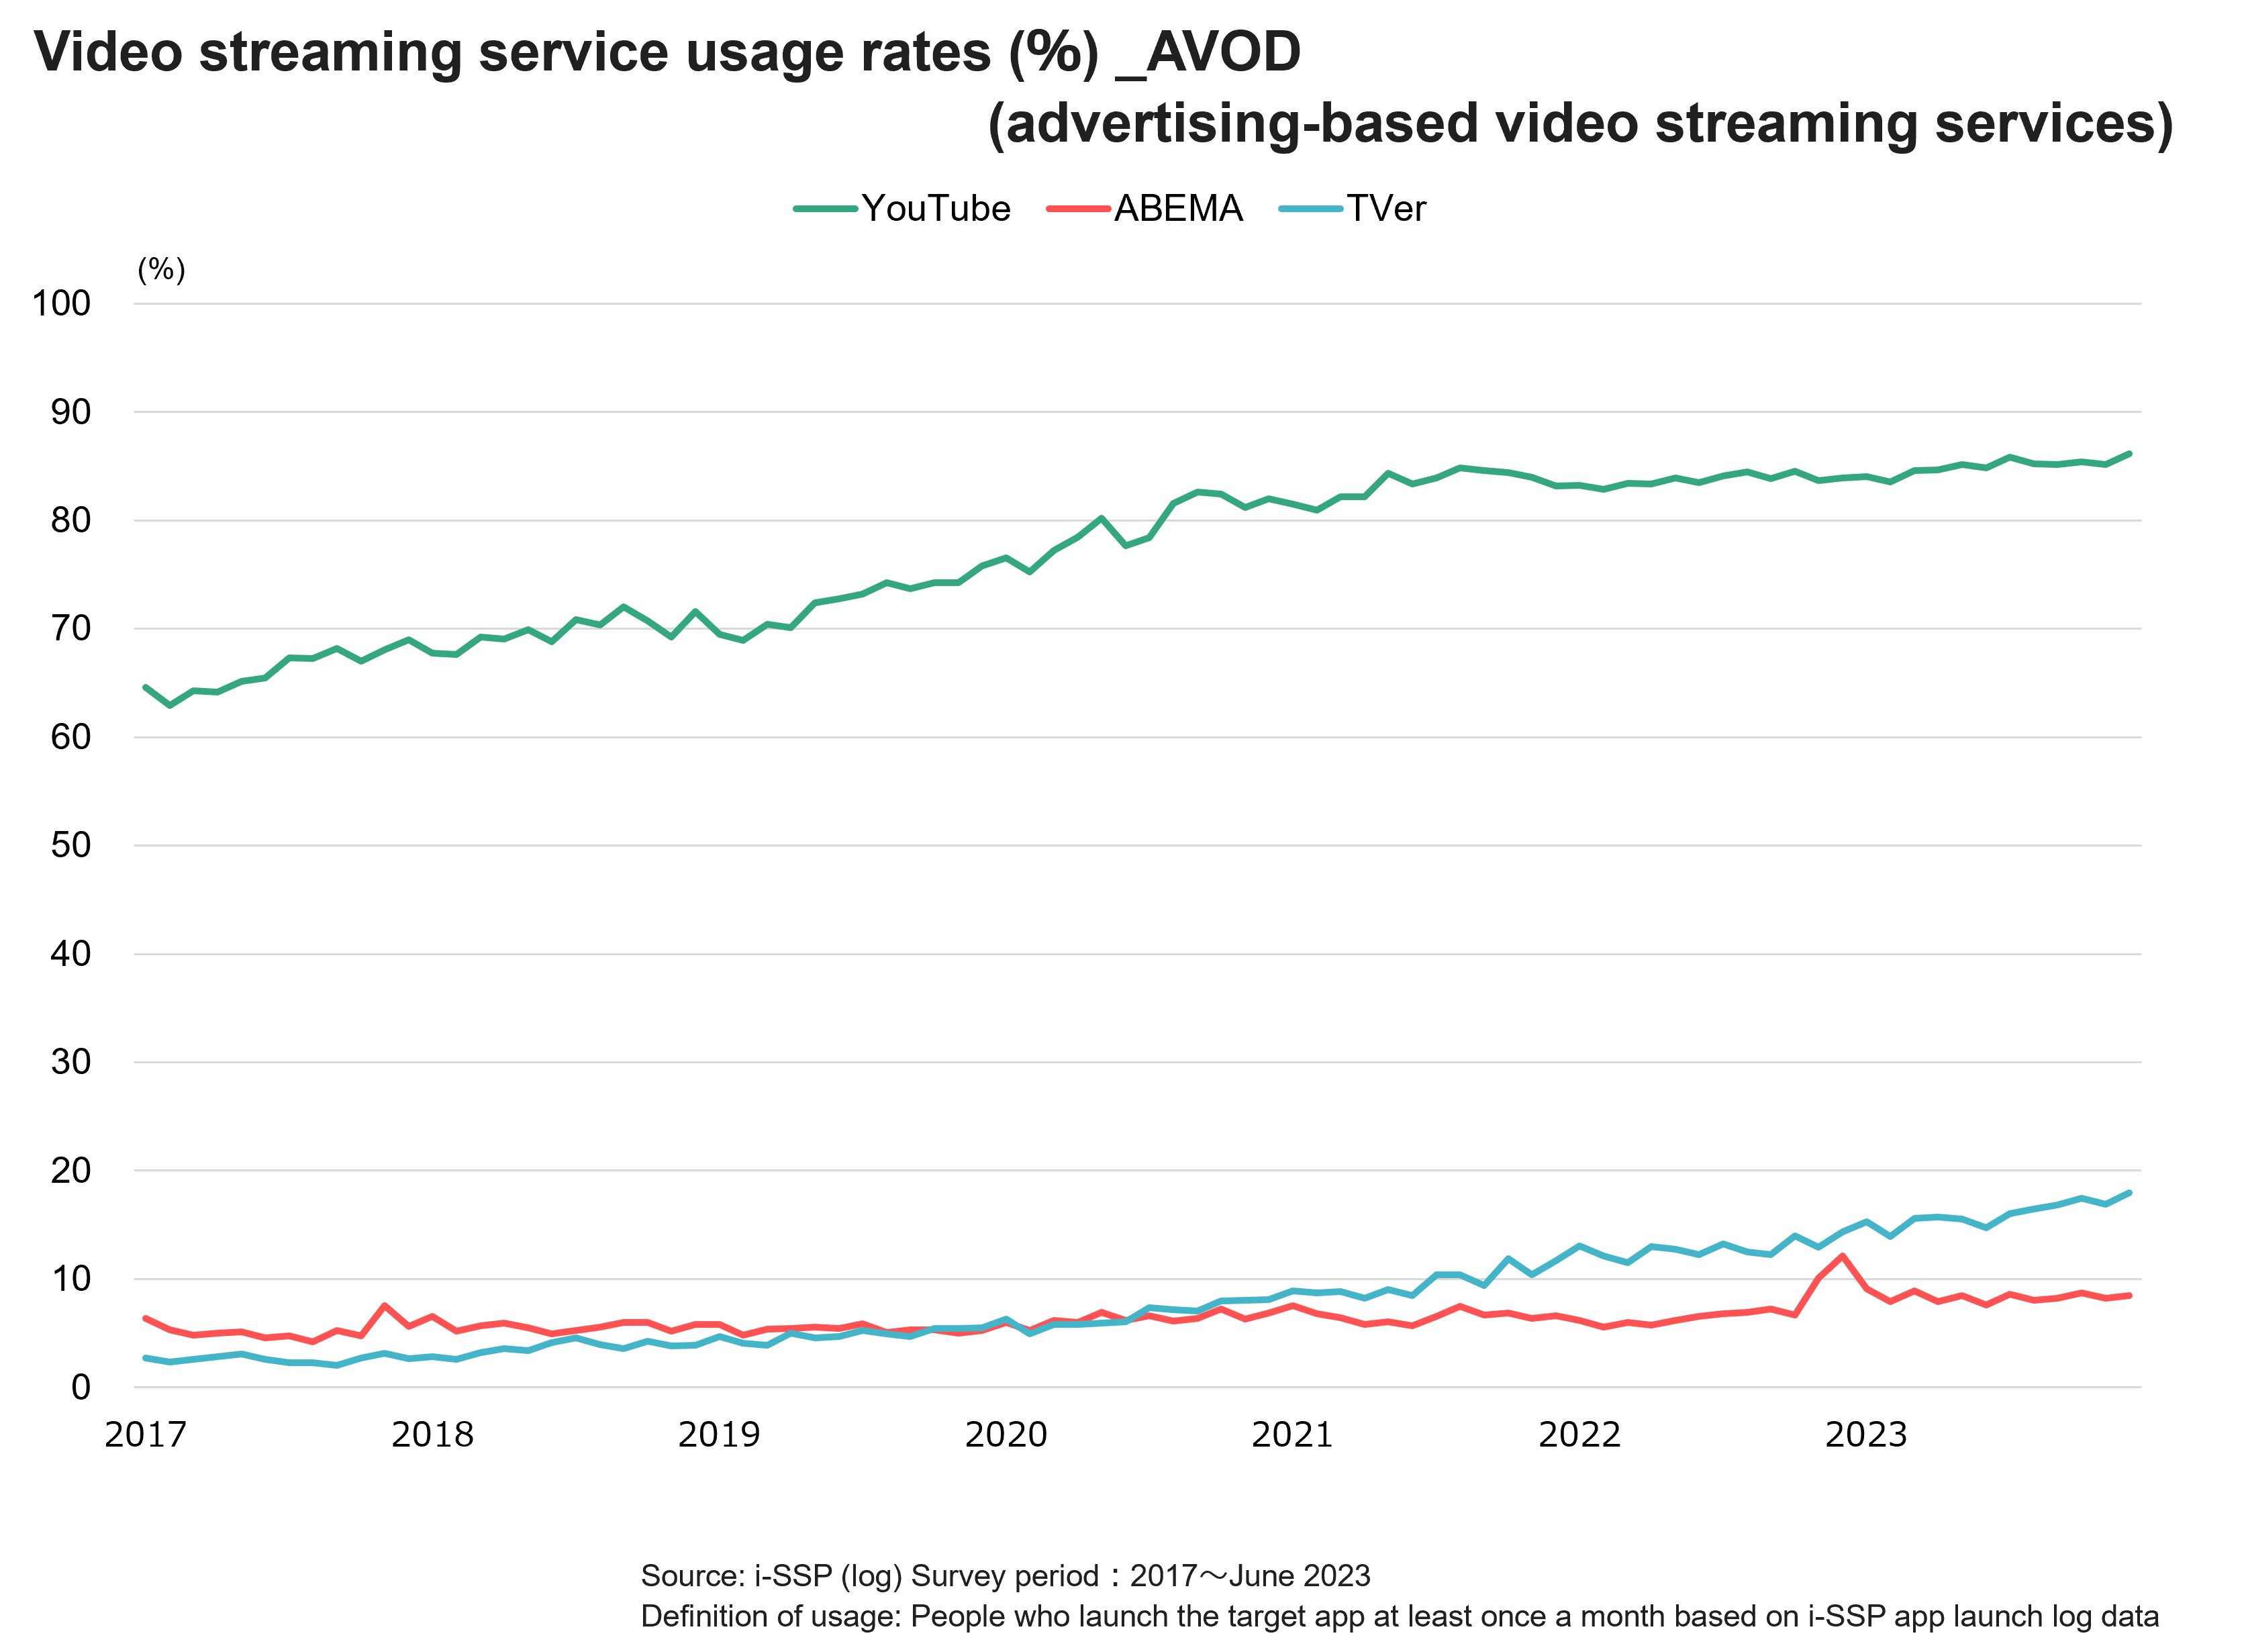
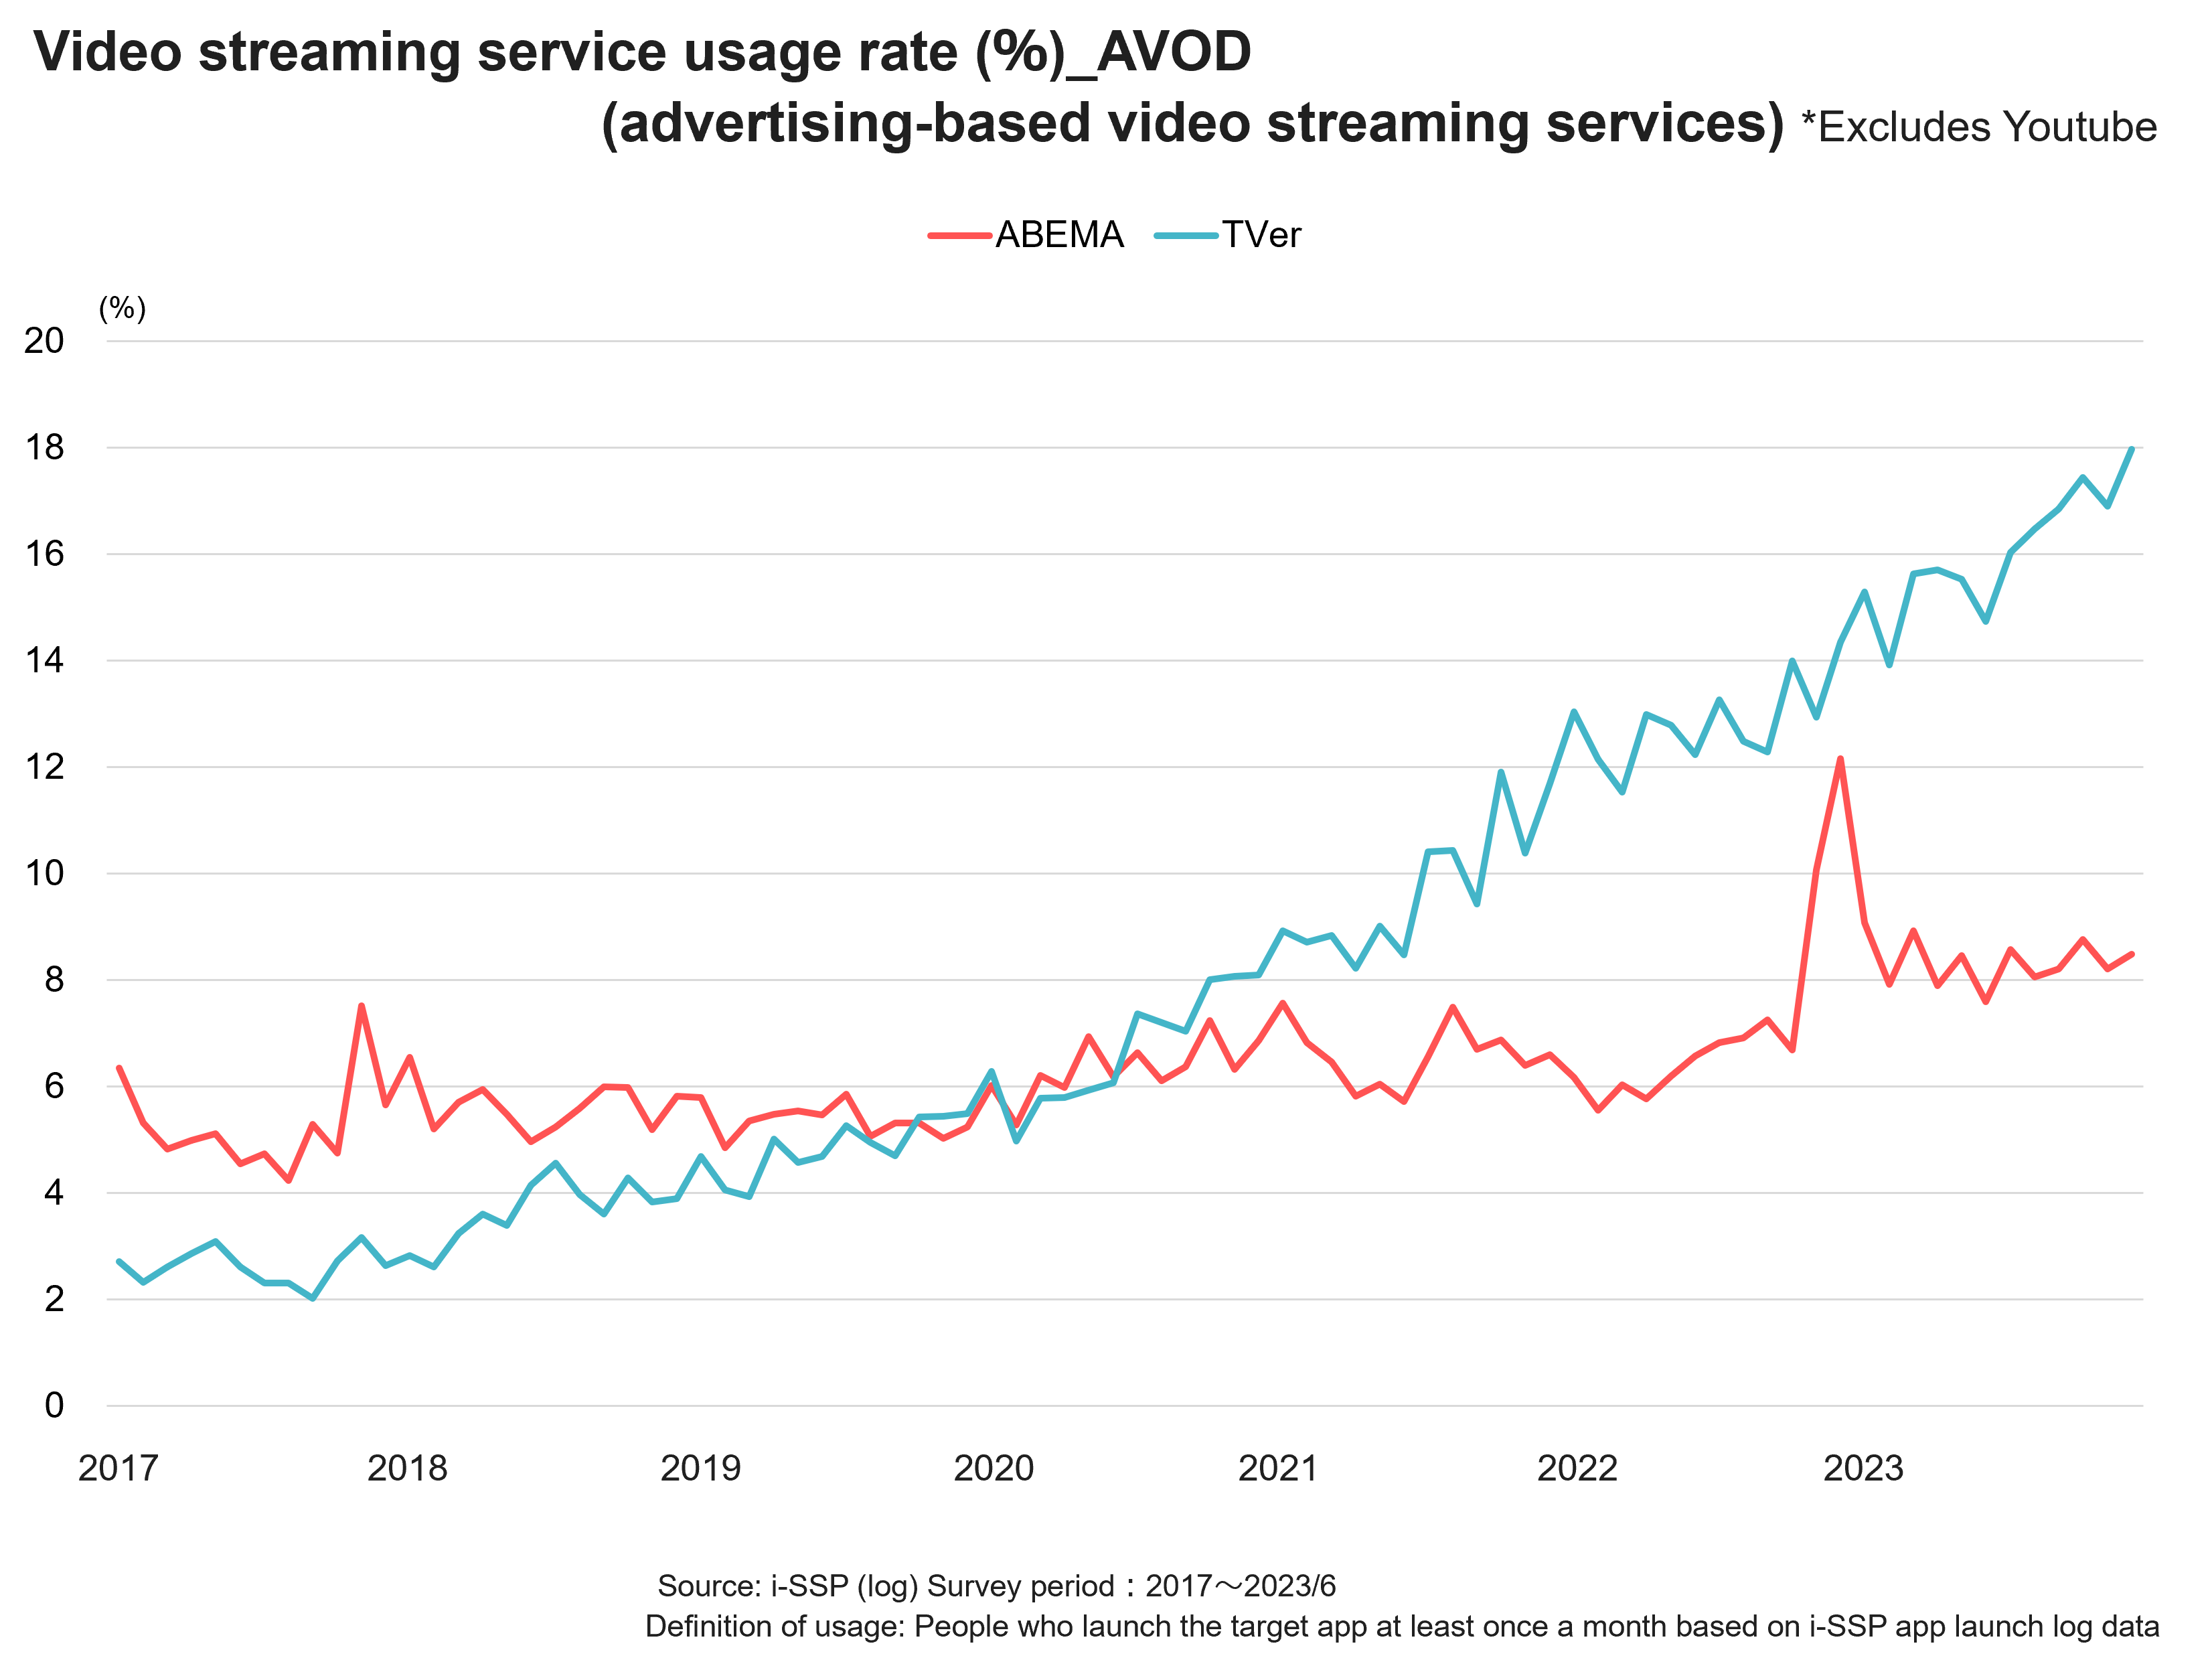
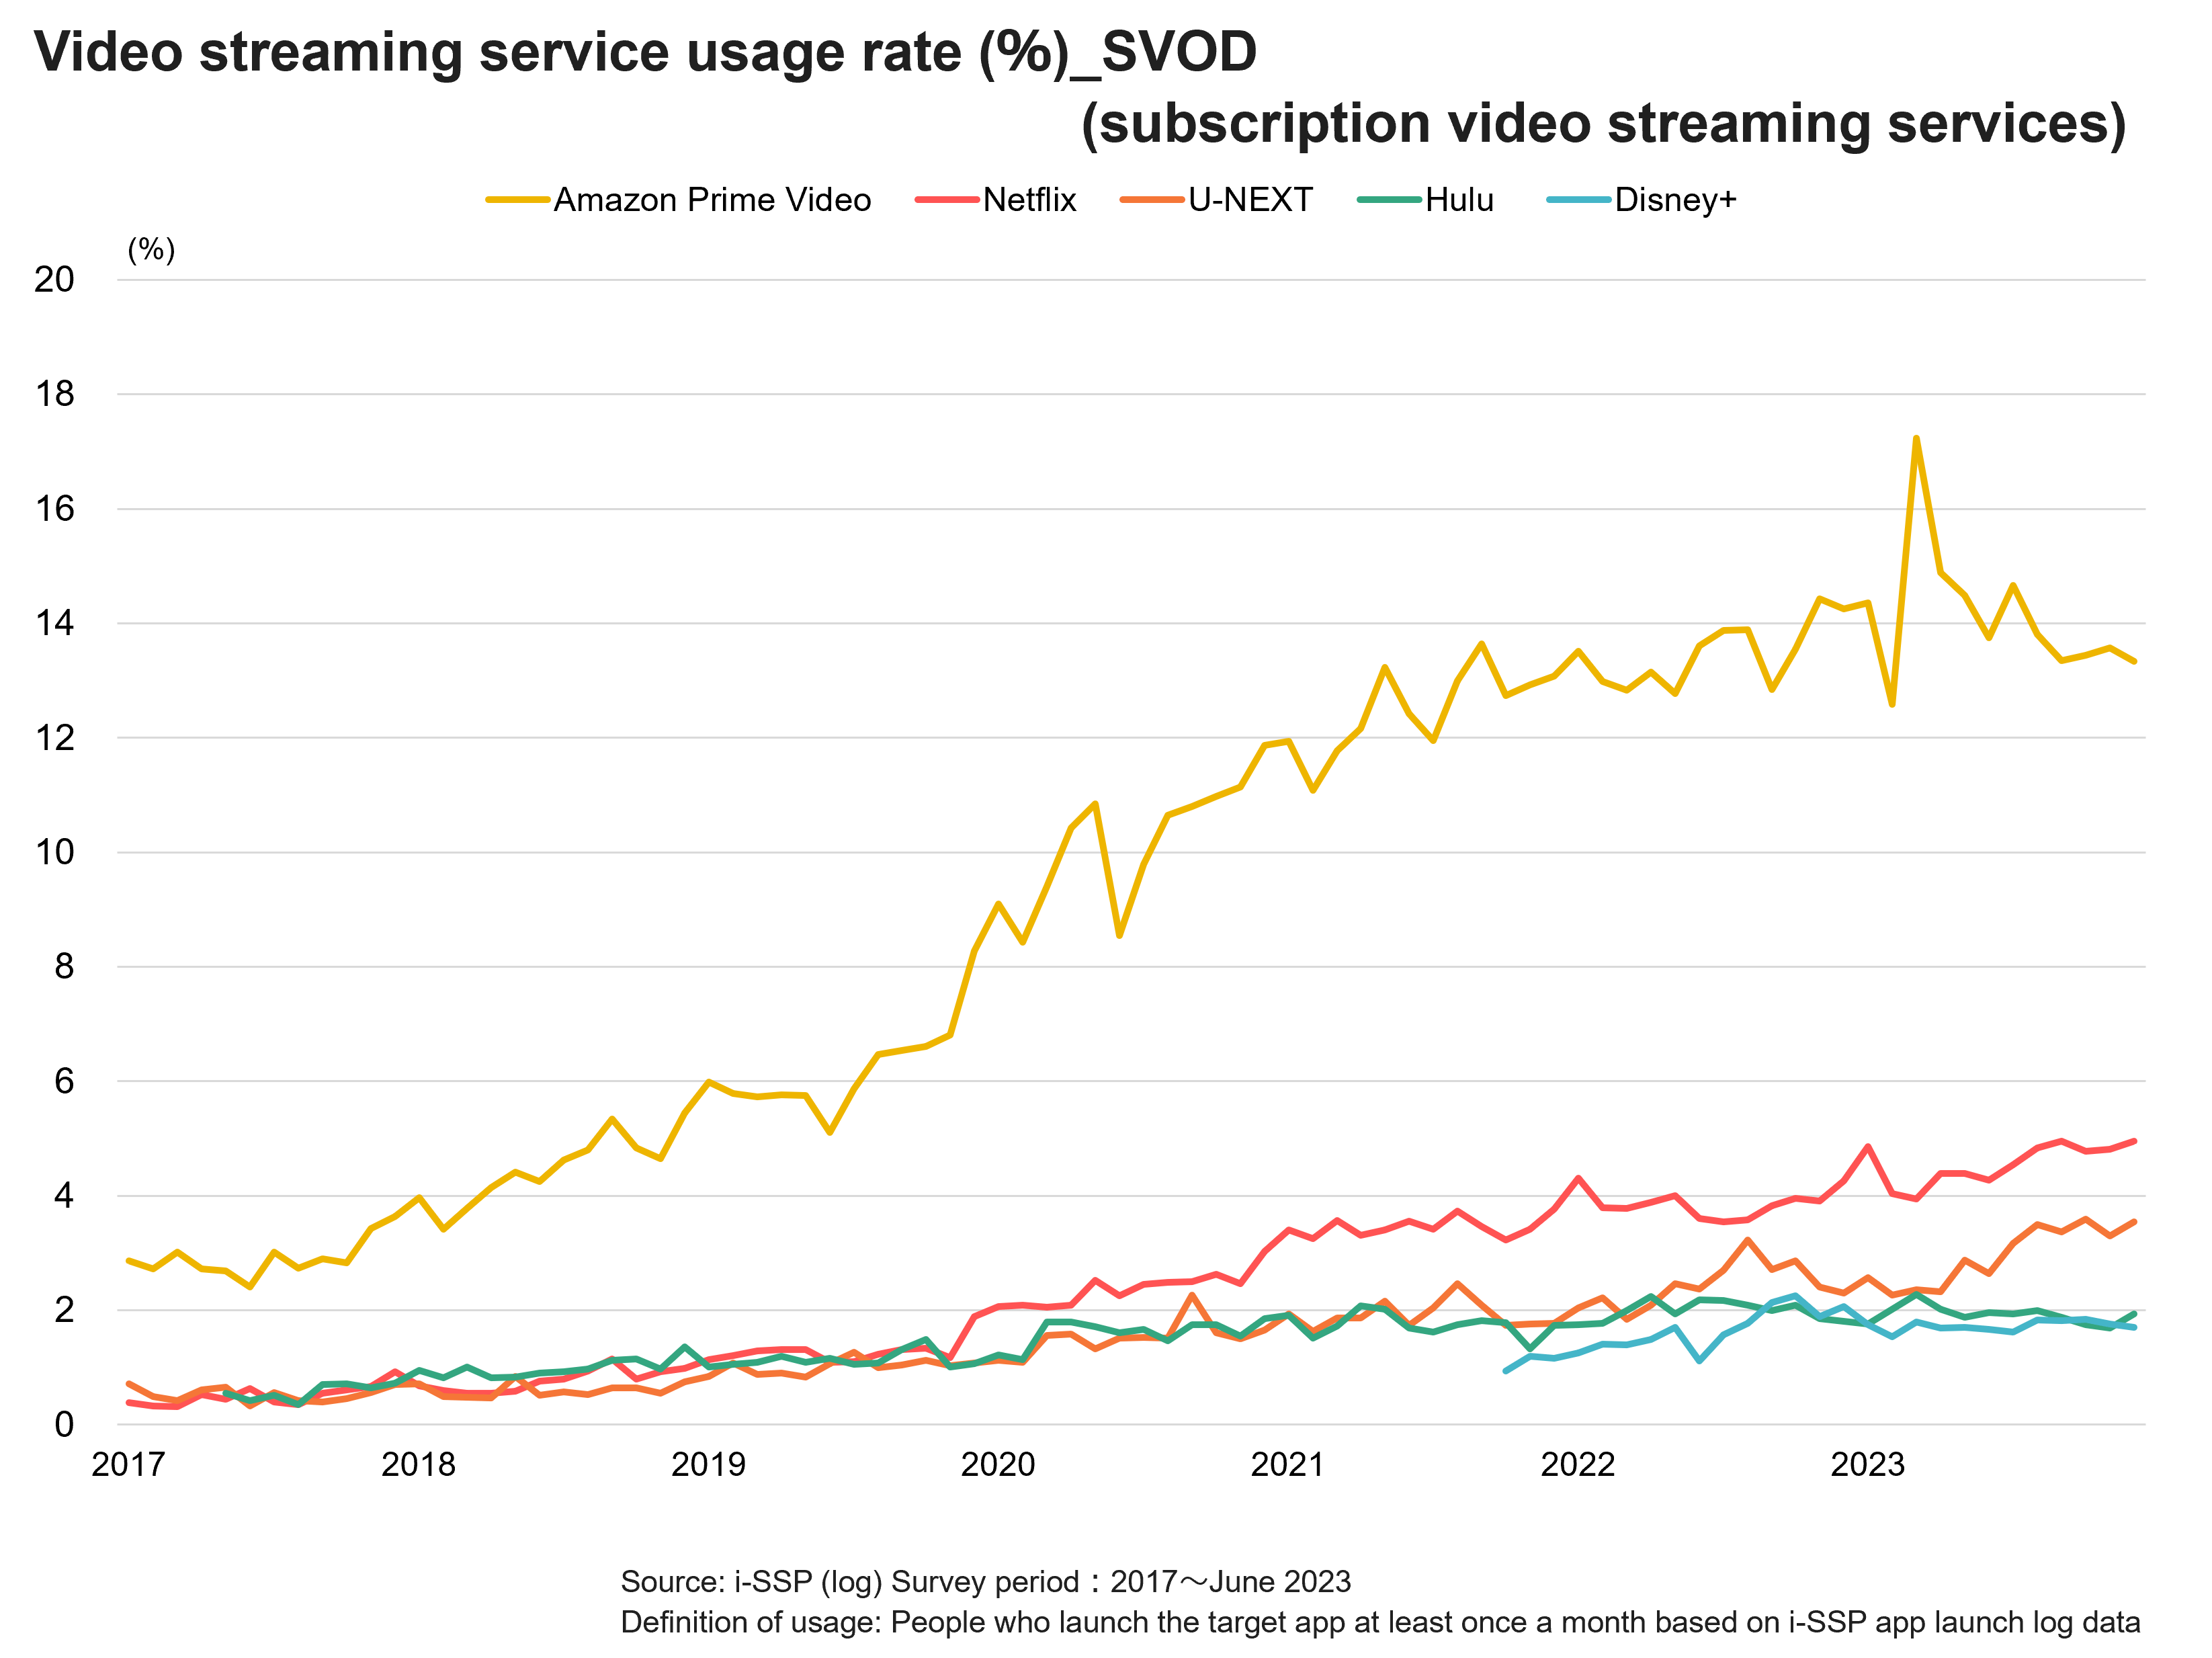
Next, let’s take a look at video streaming services. Fig.8, 9, and Fig.10 depict the shift in usage rates for AVOD (advertising-based video streaming services) and SVOD (subscription video streaming services).
Fig.8/Fig.9/Fig.10
Among AVODs, YouTube is far ahead of TVer and ABEMA. Second place TVer outperformed ABEMA in 2020 on usage rate, and has continued on an upward trend.
Among SVODs, Amazon Prime Video rated highest, with its lower monthly fee than 2nd place Netflix, and the fact that if one is an Amazon Prime net shopping member, other services including Prime Video are included (and vice versa) attributable as the reasons behind its overwhelmingly larger number of users than services that only provide video streaming services.
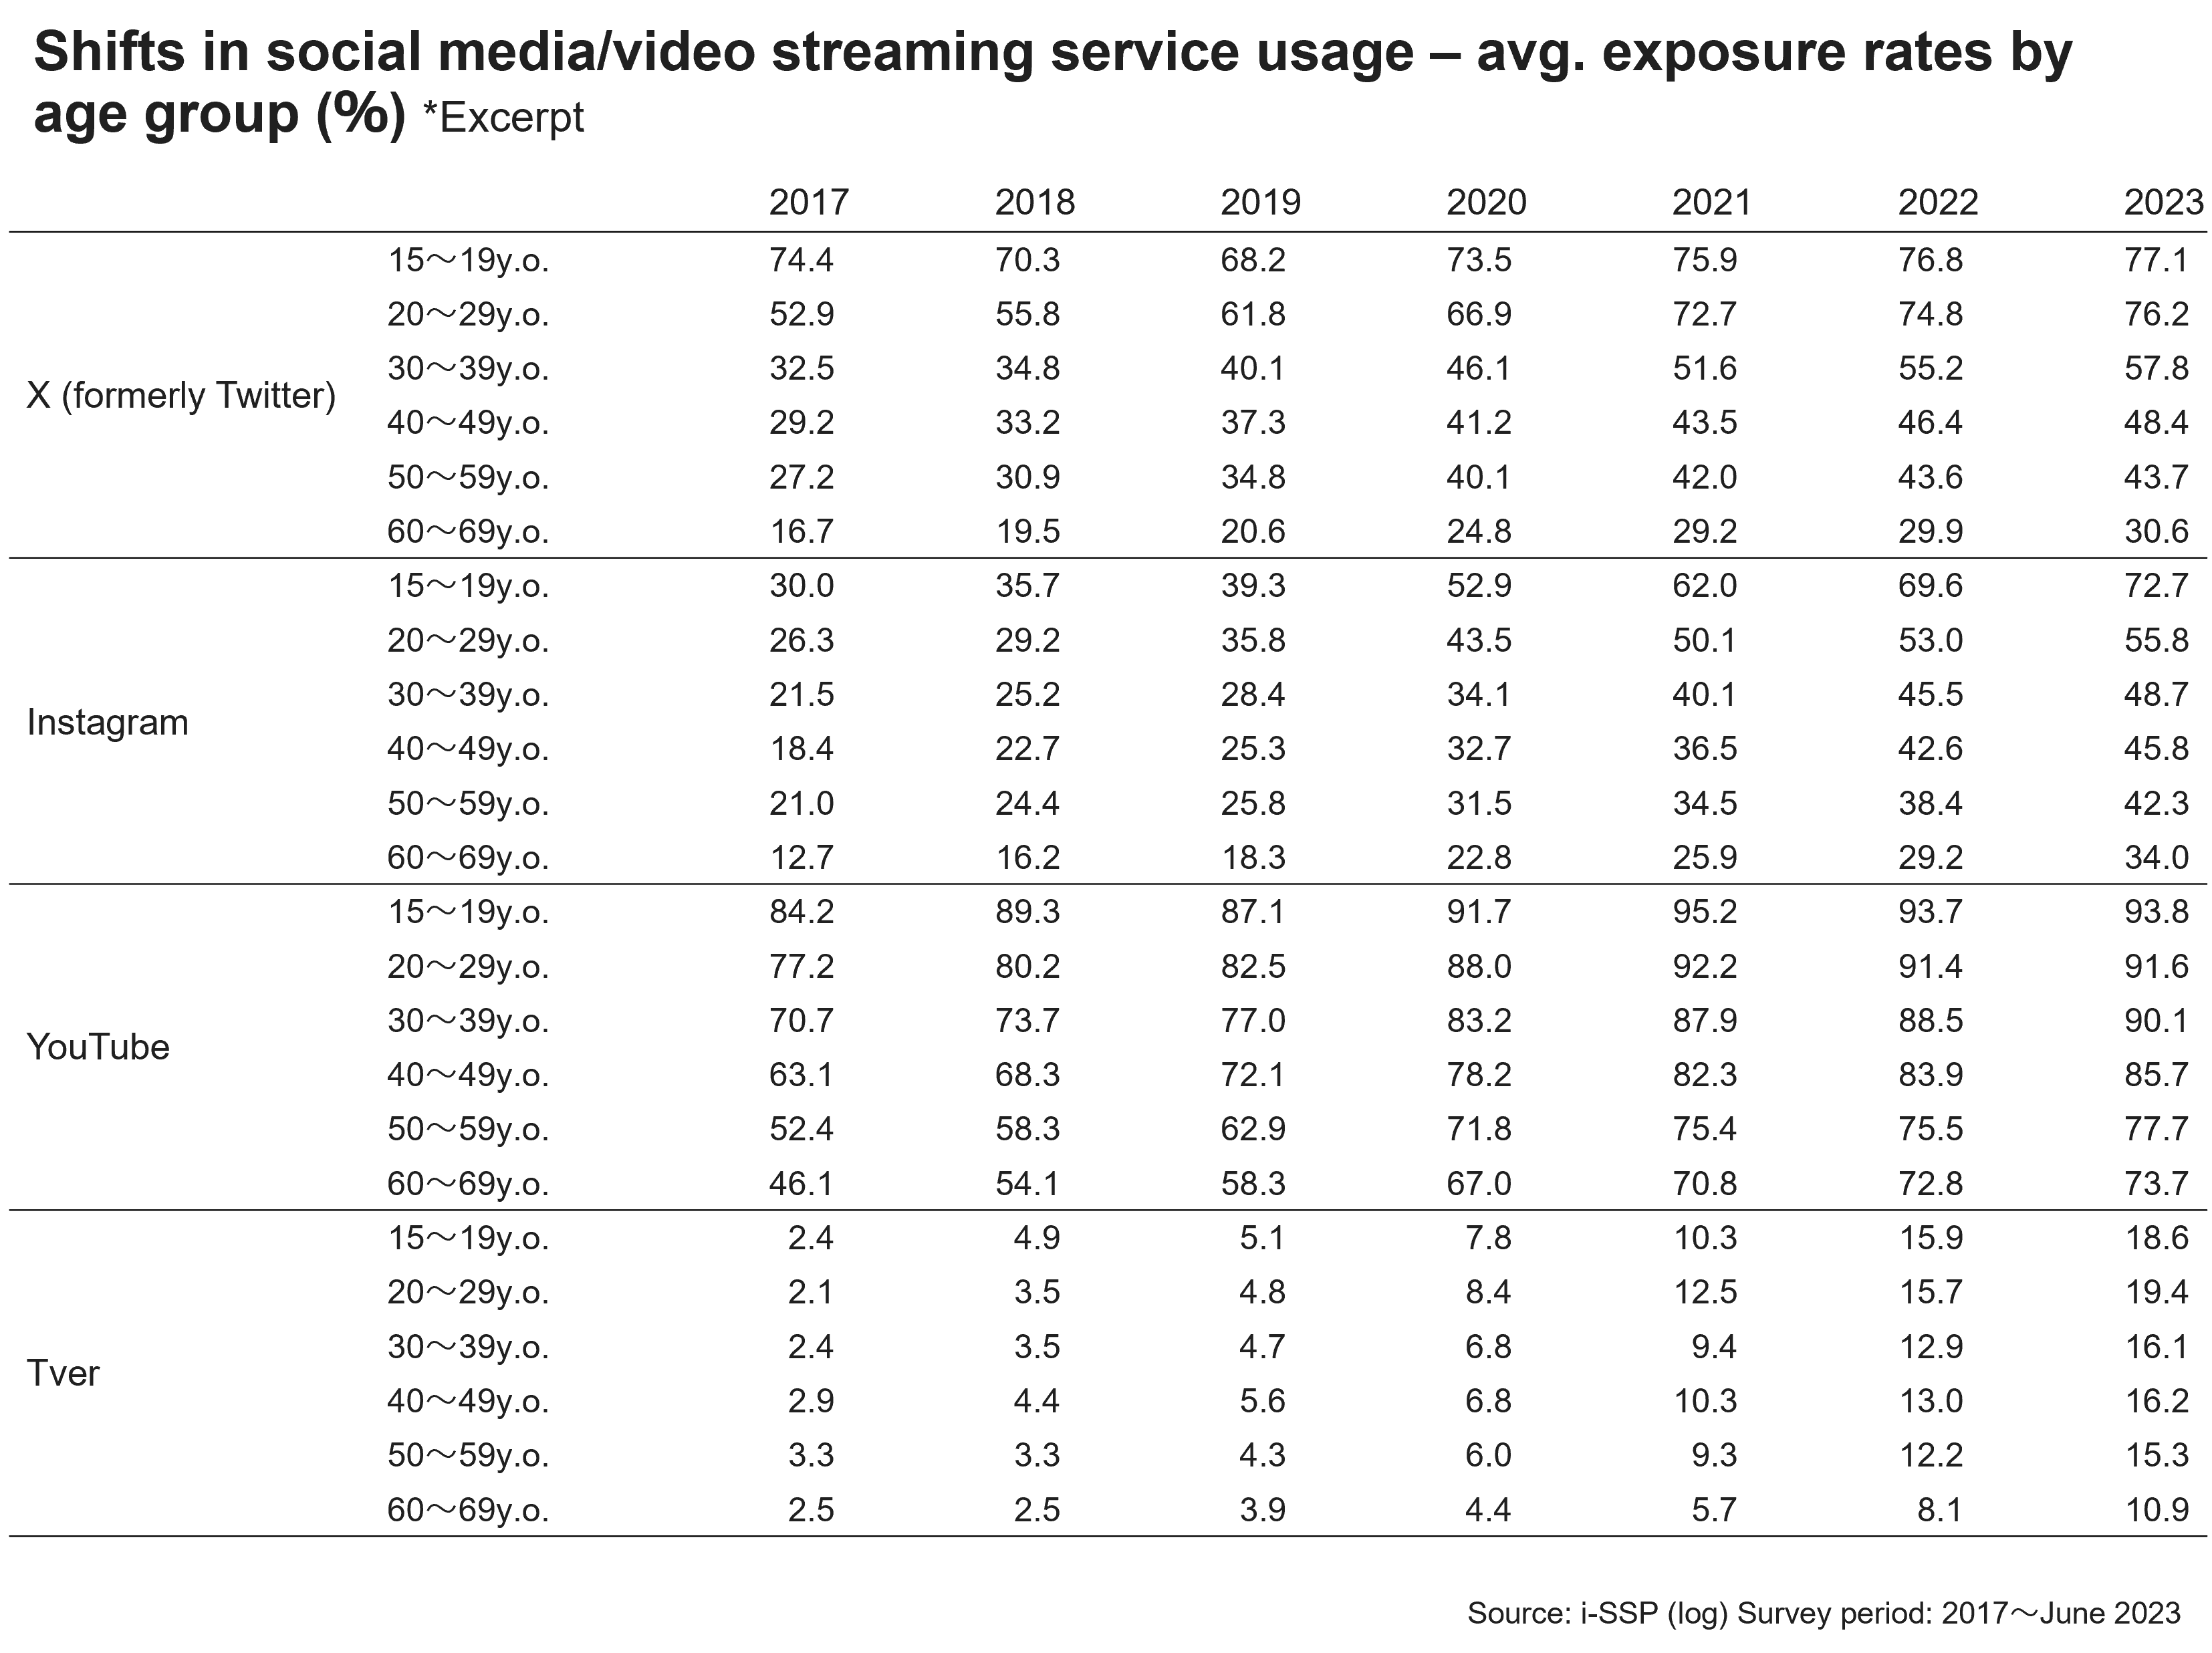
Fig.11
Finally, let’s take a look at the average monthly usage rates of the key social media apps and video streaming services mentioned above by age group. (Fig.11) The age groups with the highest usage rates for all the services mentioned here were teens and those in their 20s. As expected, the main usage of digital services is still biased towards young people.
However, on observation of growth rates among those in their 50s and older, it is apparent this has increased by about 150~200% compared to 2017. As mentioned in the section on devices and connected TVs, the use of digital devices and viewing of digital content is gradually increasing even among seniors, with this trend expected to continue in future.
4.A final word
On observation of the shifts in usage rates of the social media apps and video streaming services mentioned above, it is apparent that compared to 2017, Instagram’s usage rate has approximately doubled, TVer’s has increased about 6-fold, and Facebook’s has approximately halved. The usage time of each social media platform is also increasing due to expanded functionality, and is changing rapidly. Unlike the situation to date where mass media has been the predominant influence for many years, the way consumers are engaging with media has changed over the span of the past few years. Considering this from an advertising communication measure perspective, it is becoming difficult to achieve the desired effects through following last year’s measures.
Also, as mentioned at the beginning of this article, although several buzzwords exist that describe these media trends like “young people’s move away from TV” and the “digital shift”, on examination of the actual data, it doesn’t accurately encapsulate the whole picture while this is partially true. There is thus a gap between perception and reality, and especially in terms of perceptions, this can differ even among stakeholders. If we discuss advertising communication policies in this state, we may not be able to take more effective and efficient measures, and the discussion may be derailed, so why not engage in discussions here after reaching a consensus based on factual data?
[i-SSP® (INTAGE Single Source Panel ®)] Based on INTAGE’s SCI (nationwide individual consumer panel survey), this data is newly collected from the same respondents regarding their website viewing and TV viewing from PCs, smartphones, and tablet devices. This data clarifies the relationship between consumer behavior and information exposure as well as ad efficacy through analysis of their usage trends and exposure rates to TVs, PCs, smartphones, and tablet devices along with the shopping data gathered from these very same respondents. In addition, a separate questionnaire survey can be conducted with respondents to probe and analyze them on their outlooks, values, and state of purchase of durable goods and services. * Single Source Panel® is the registered trademark of INTAGE Inc.
Reproduction and Quotation
◆This report is copyrighted by INTAGE Inc. Please check the following prohibitions and precautions, and specify the source when reproducing or quoting this report. “Source: INTAGE “Knowledge Gallery” article published MM/DD/YYYY article”
◆The following are prohibited: ・Alteration of this article in full or in part ・Sale or publication of this article in full or in part ・Uses that are against public order and morality, and uses connected with illegal activities ・Reproducing or quoting panel data* for the purpose of advertising or promoting companies, products, or services *Panel data include: SRI+, SCI, SLI, Kitchen Diary, Car-kit, MAT-kit, Media Gauge, i-SSP, etc.
◆Other precautions: ・INTAGE Inc. shall not be liable for any trouble, loss, or damage caused by the use of this report ・These usage rules do not restrict the use of quotations or other uses permitted under the Copyright Act of Japan
◆For inquiries about reproduction and quotation, click here