1. Increased awareness about economizing and how “economizing is growing old”
The prices of a variety of items have continued to rise this year as well. In last month’s column, we reported on keywords that reflect our present like “acclimatization to price increases” and “growing tired of economizing”. Let’s take a look at the mindset surrounding economizing this time based on the results of another survey.
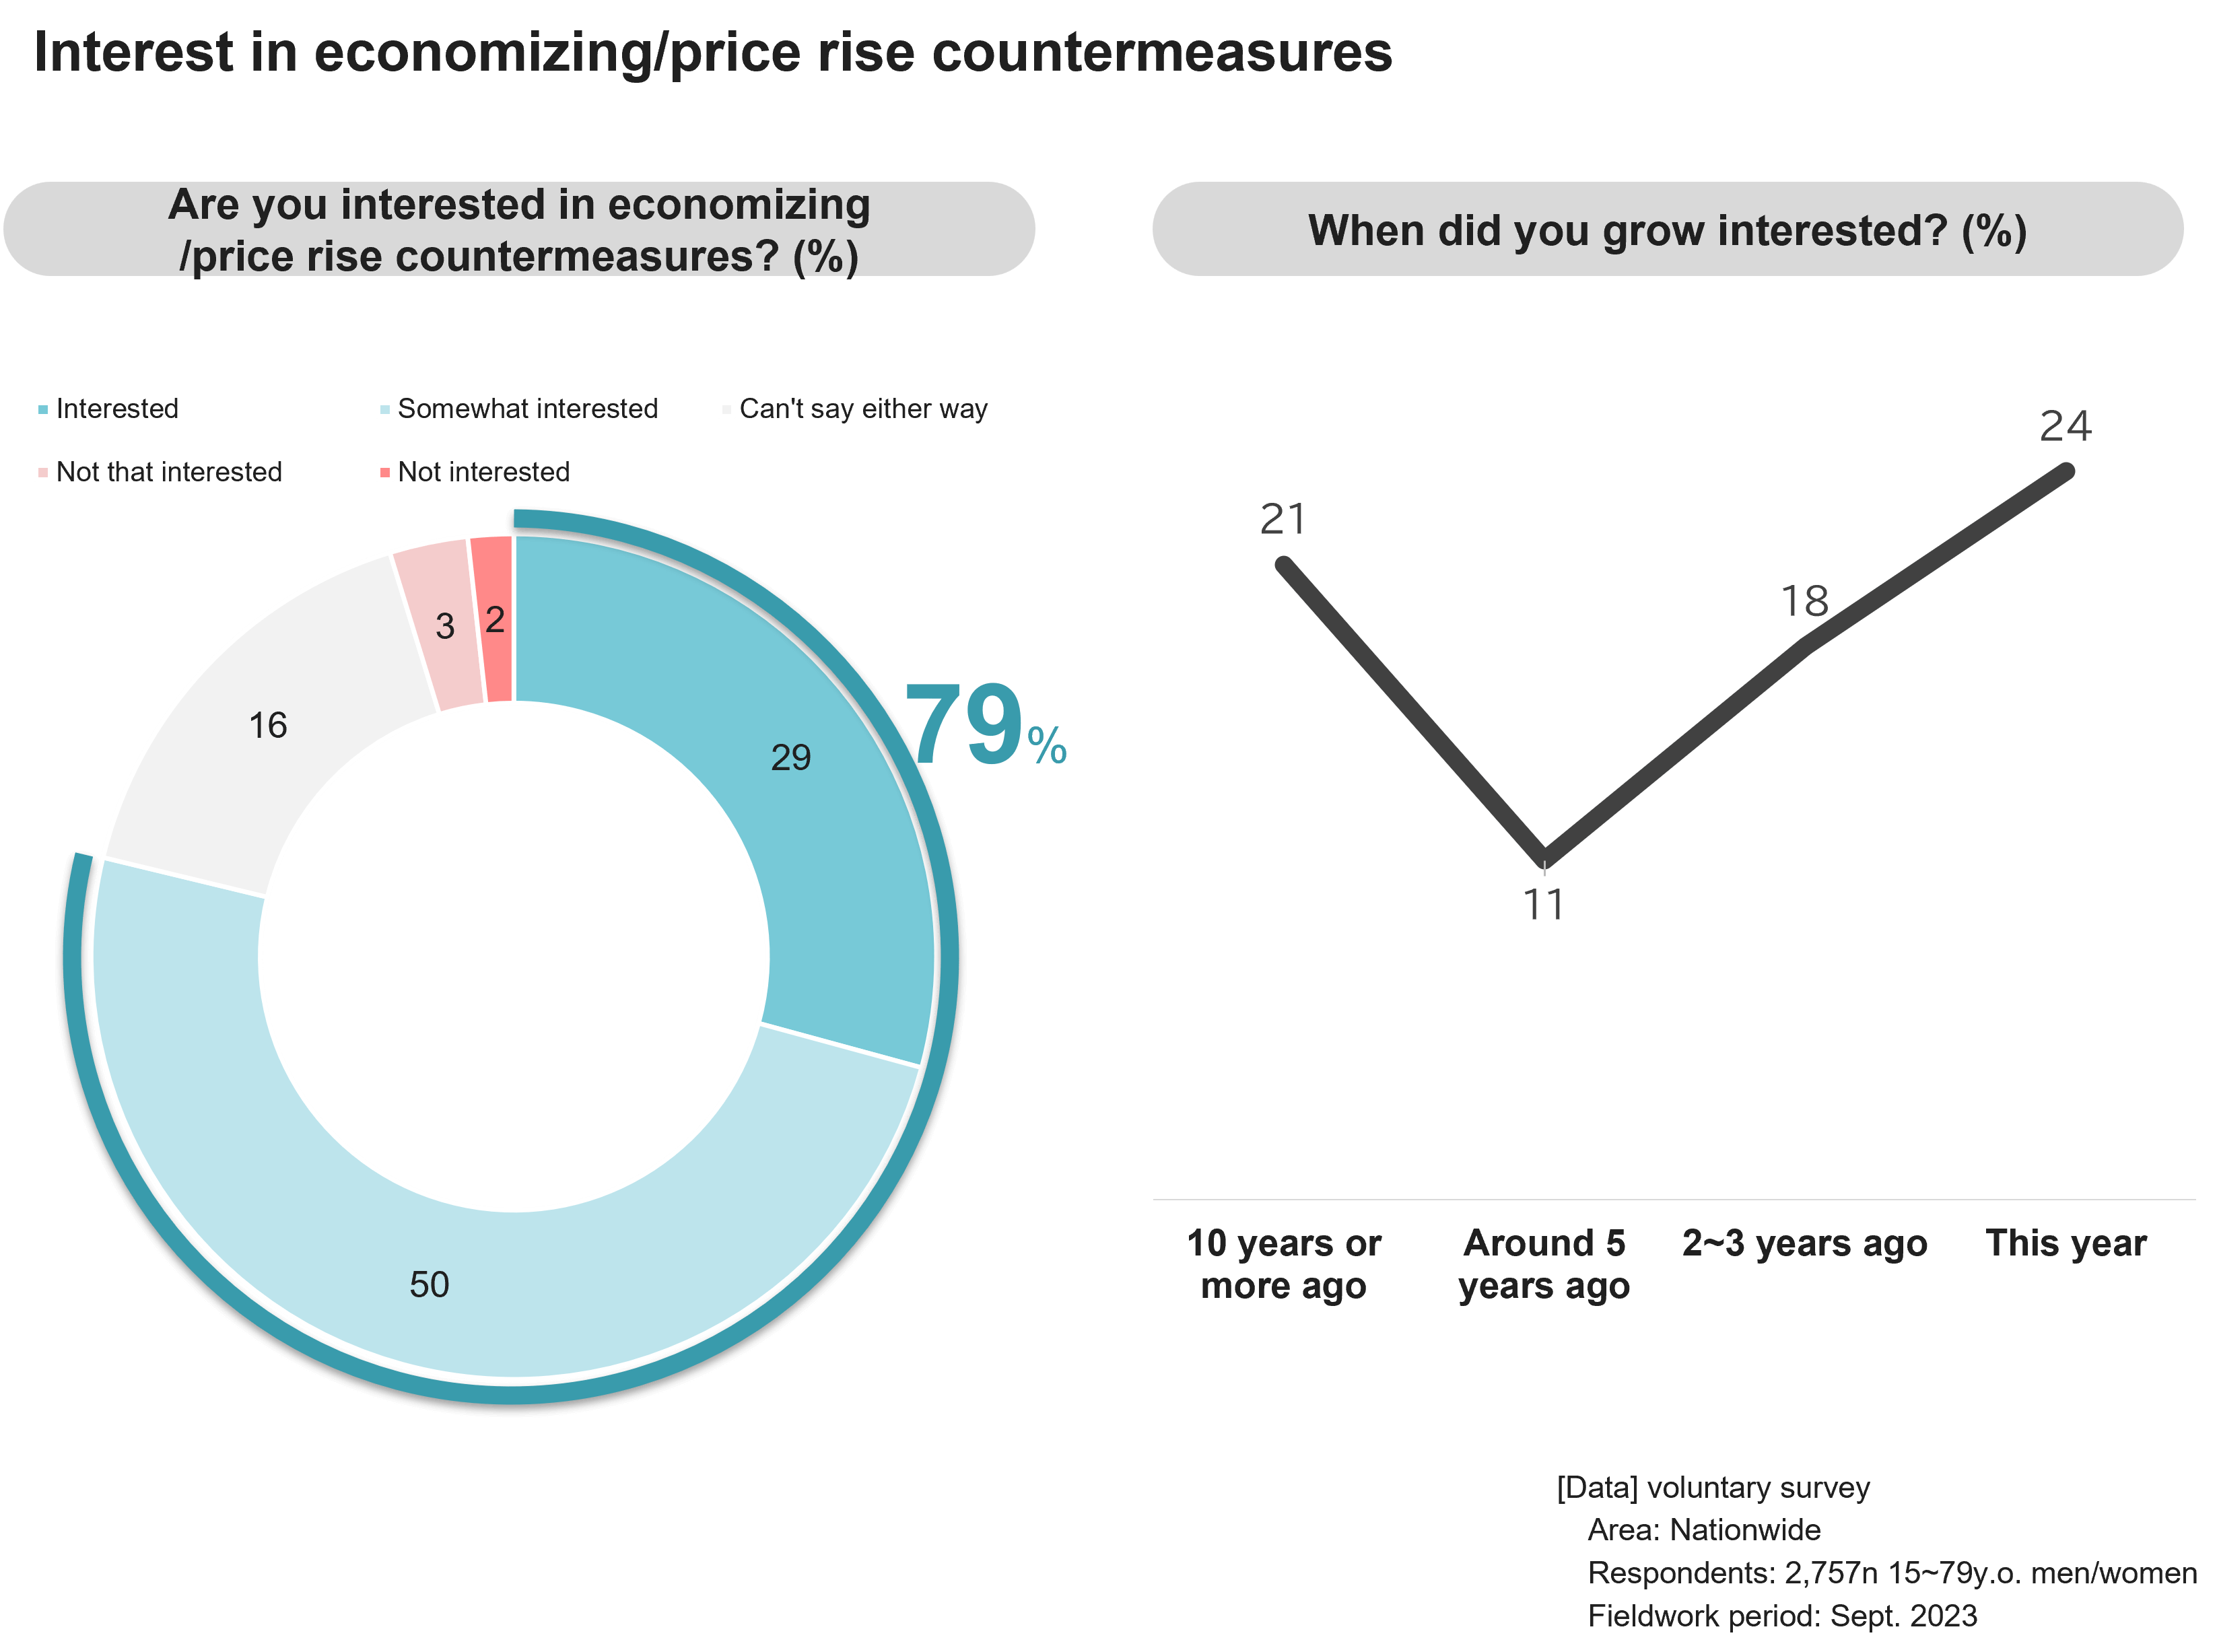
Approximately 80% of consumers note they are “interested” or “somewhat interested” in rising prices and economizing, with both issues now matters that people simply can’t help having an interest in (Fig 1). When asked when they developed this mindset, approximately one in four people (24%) responded “This year (2023)”. Another 18% responded “2~3 years ago”. Concern about household purse strings during the covid crisis are coinciding with ongoing price increases, driving this heightened awareness about “economizing”. On the other hand, 21% of people responded “More than 10 years ago”, indicating awareness about economizing rose during the economic downturn caused by the Lehman Shock (2008).
Fig 1
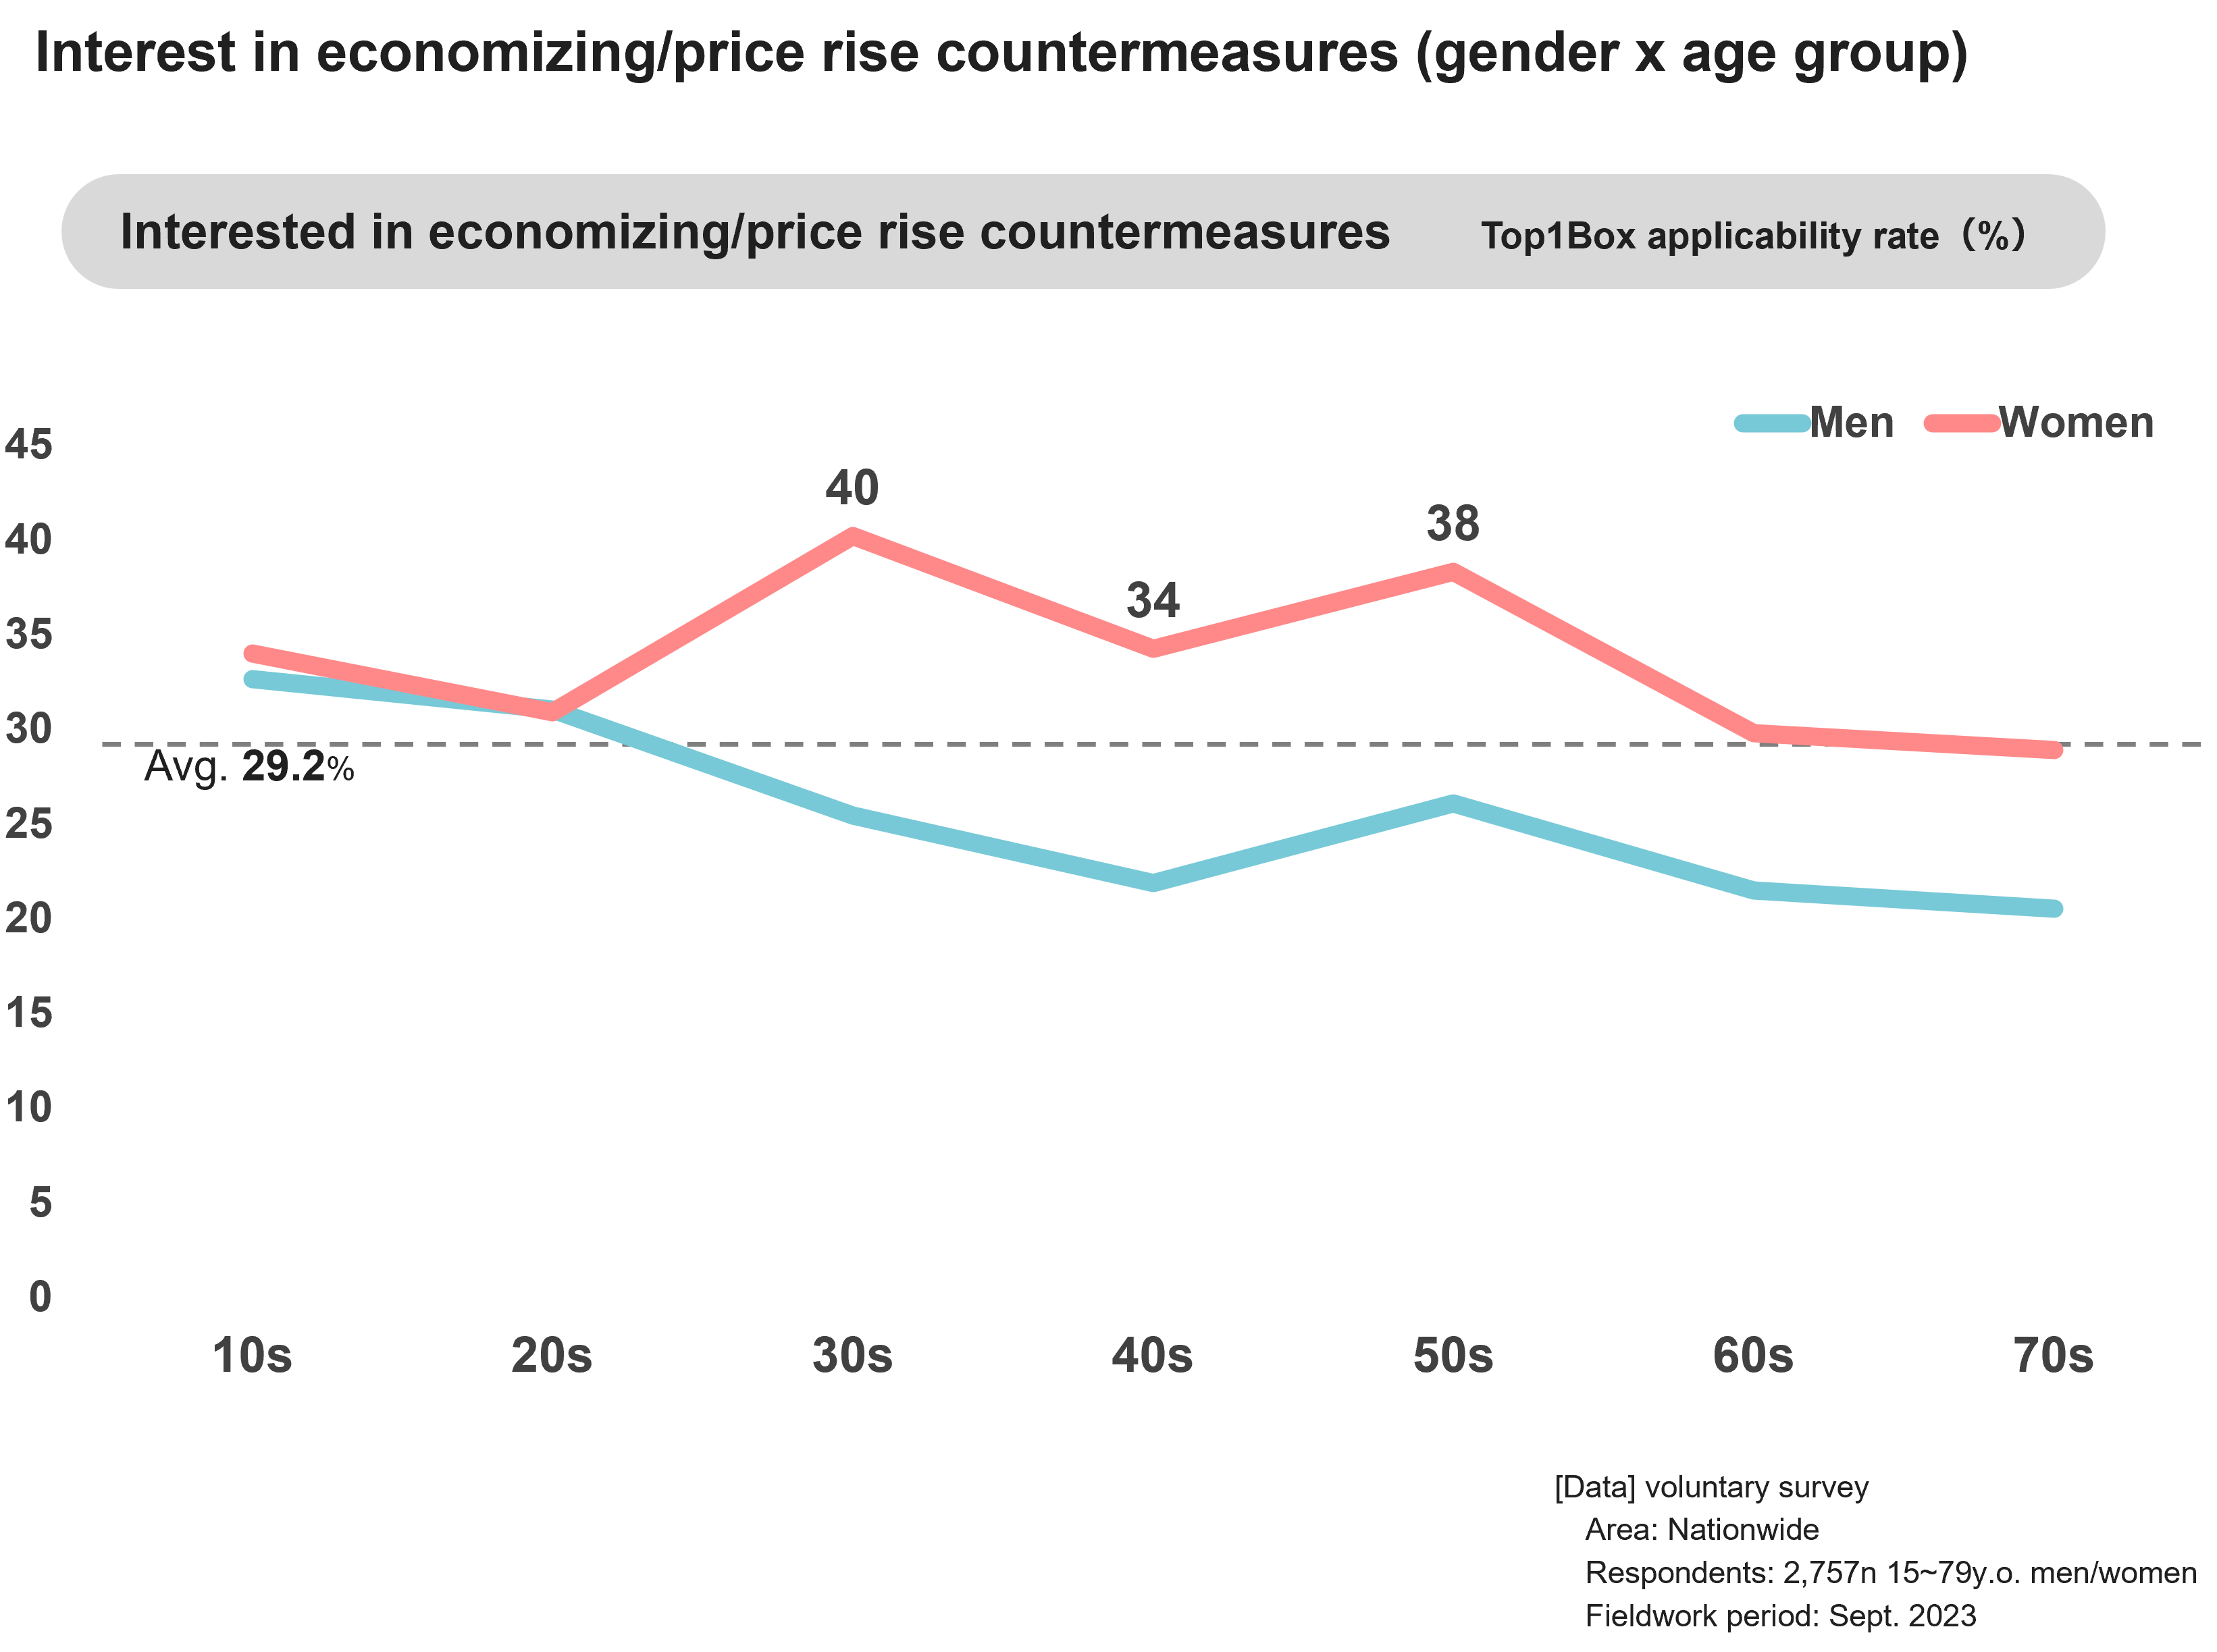
On observation of interest in economizing/price rise countermeasures by gender and age group, women in their 30s, 40s, and 50s are more interested than average (Fig 2). Many women shop for groceries and daily necessities on a daily basis, and look at utilities bill statements etc. to make ends meet, so tend to be sensitive to price rises, and appear to have an increased awareness about economizing. Men on the other hand tend to have less awareness about economizing the older they are, with a very large gap between men and highly aware women in their 30s ~ 50s. There are thus concerns that differences in outlooks on engaging in “economizing” may be occurring within families.
Fig 2
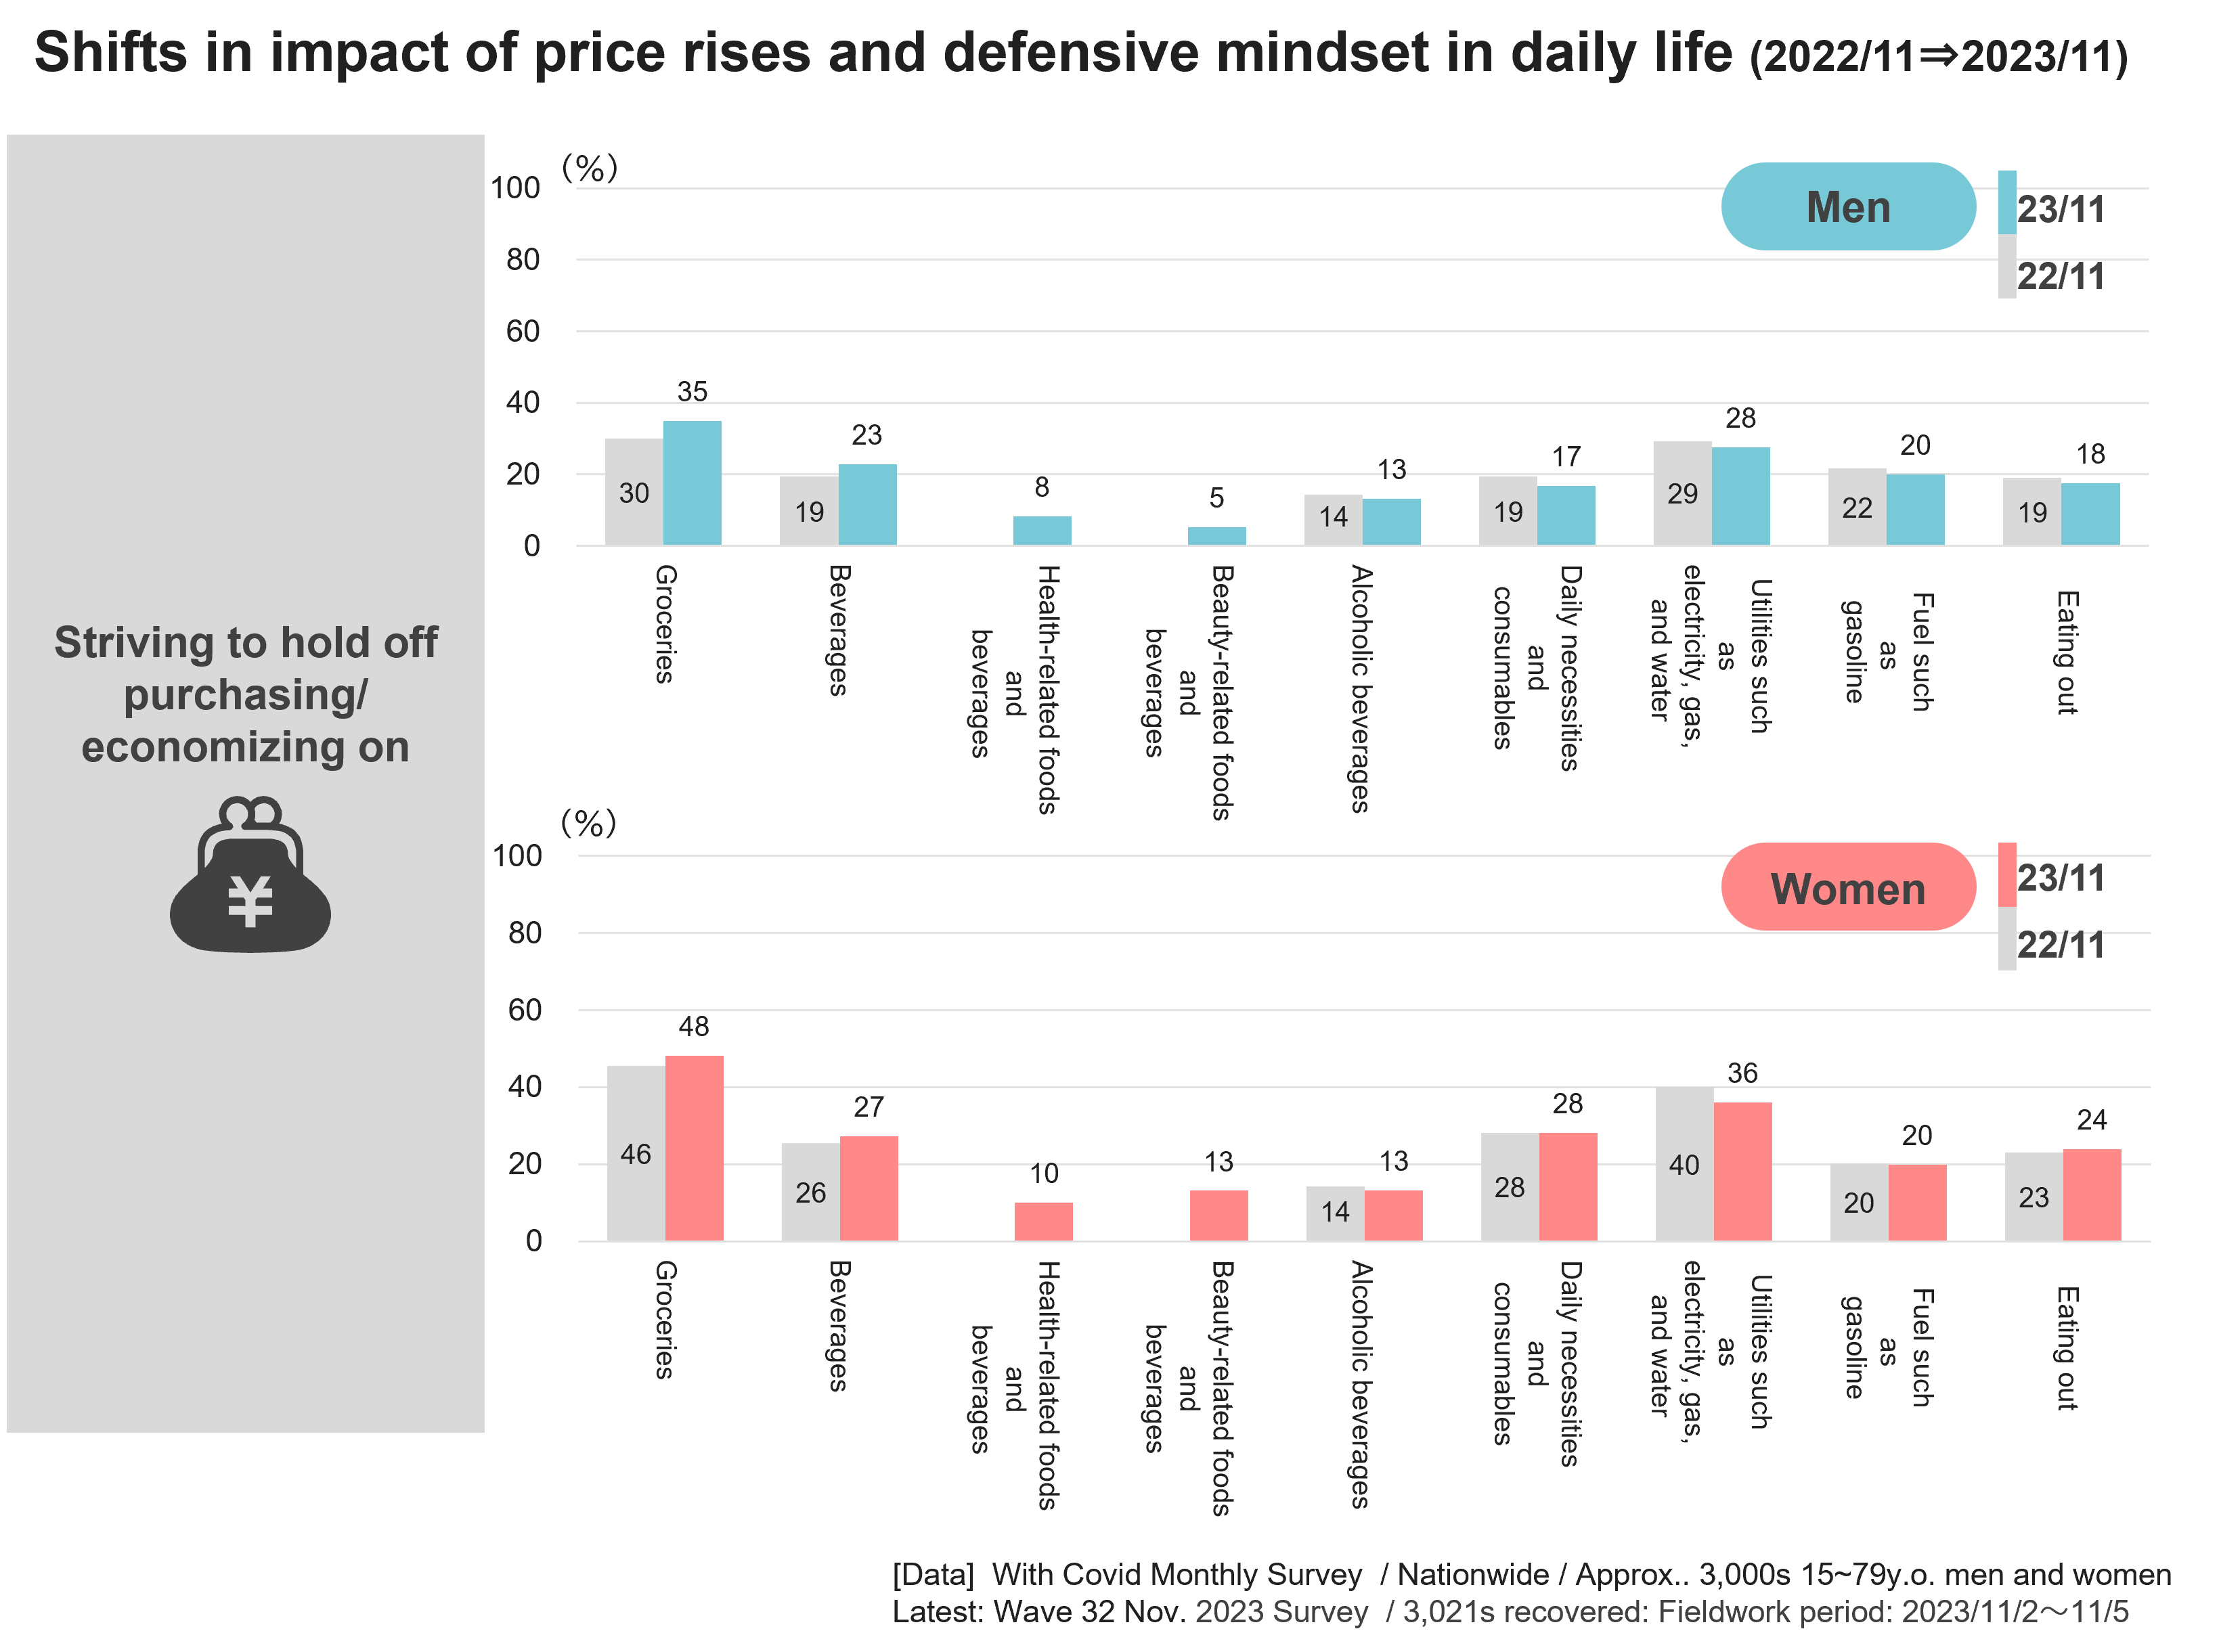
Next, let’s take a look at the types of items people are trying to hold off purchasing or economizing on due to perceptions of rising prices by genre (Fig 3). “Groceries”, “utilities”, “daily necessities and consumables”, “and beverages” rate highly among both men and women. However, as we discussed earlier regarding awareness about economizing, women are more aware of these factors than men.
Next, on chronological comparison with scores from a year ago, “Groceries” and “Beverages” rated higher in November 2023. The prices of various products such as groceries and beverages have repeatedly increased throughout the year, and these results indicate that consumers are feeling these price rises.
Fig 3
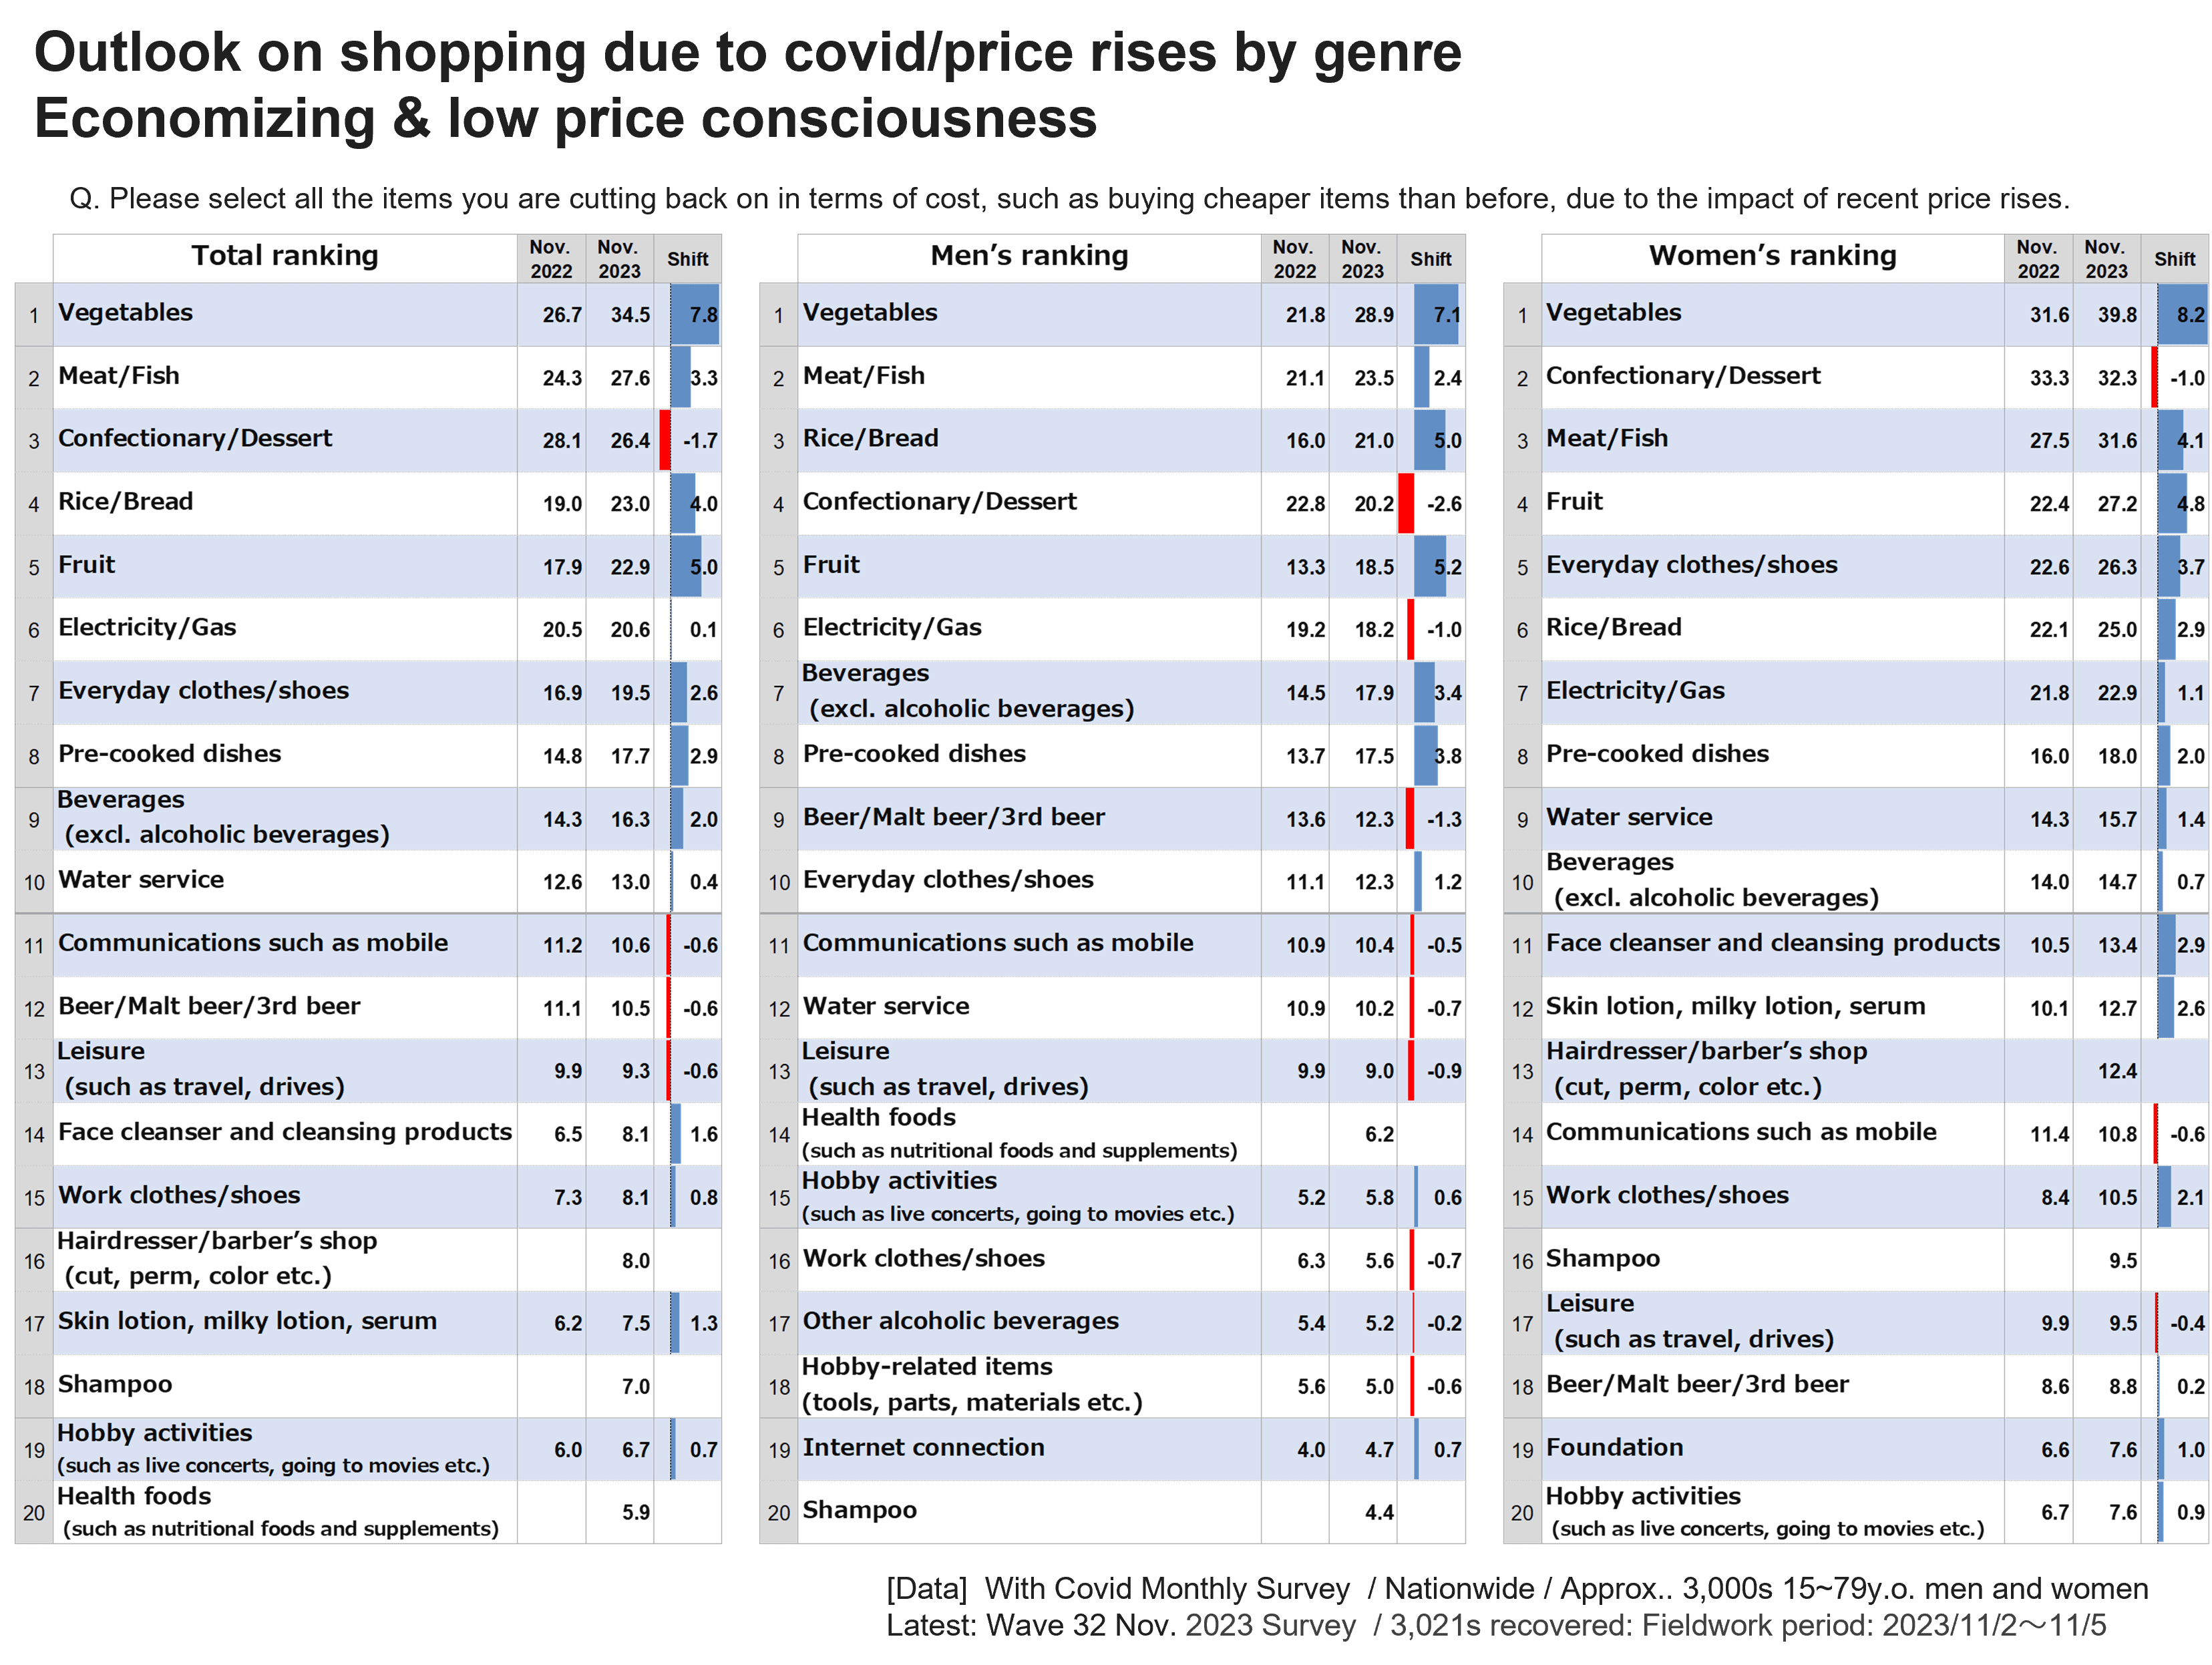
On close examination of the genres/items people are holding off purchasing/economizing on, items considered the basis of one’s dietary lifestyle including “vegetables”, as well as “meat/fish” and “rice/bread” rate highly (Fig 4). On comparison of changes in awareness about economizing chronologically as well, awareness about economizing with these genres/items is increasing, suggesting this mindset has become increasingly entrenched among consumer over the past year.
On the other hand, while “sweets/desserts” also ranked highly (3rd among the total, 4th among men, and 2nd among women), awareness about economizing with them is on somewhat of a downward trend. In last month’s column, we introduced survey results showing that “going on to purchase expensive desserts and sweets” is a phenomenon symbolic of “growing tired of economizing”. How about your awareness about economizing? Have you also started to seek “little tastes of luxury” as a reward for trying hard to economize?
Fig 4
2. Changes in shopping outlay – Where are those spending less going?
As we’ve seen thus far, as prices continue to rise, consumers appear to be innovating with holding off purchasing, economizing etc. But is the way they are actually spending changing? Let’s examine this using the “purchase value” data from INTAGE’s SCI consumer panel data.
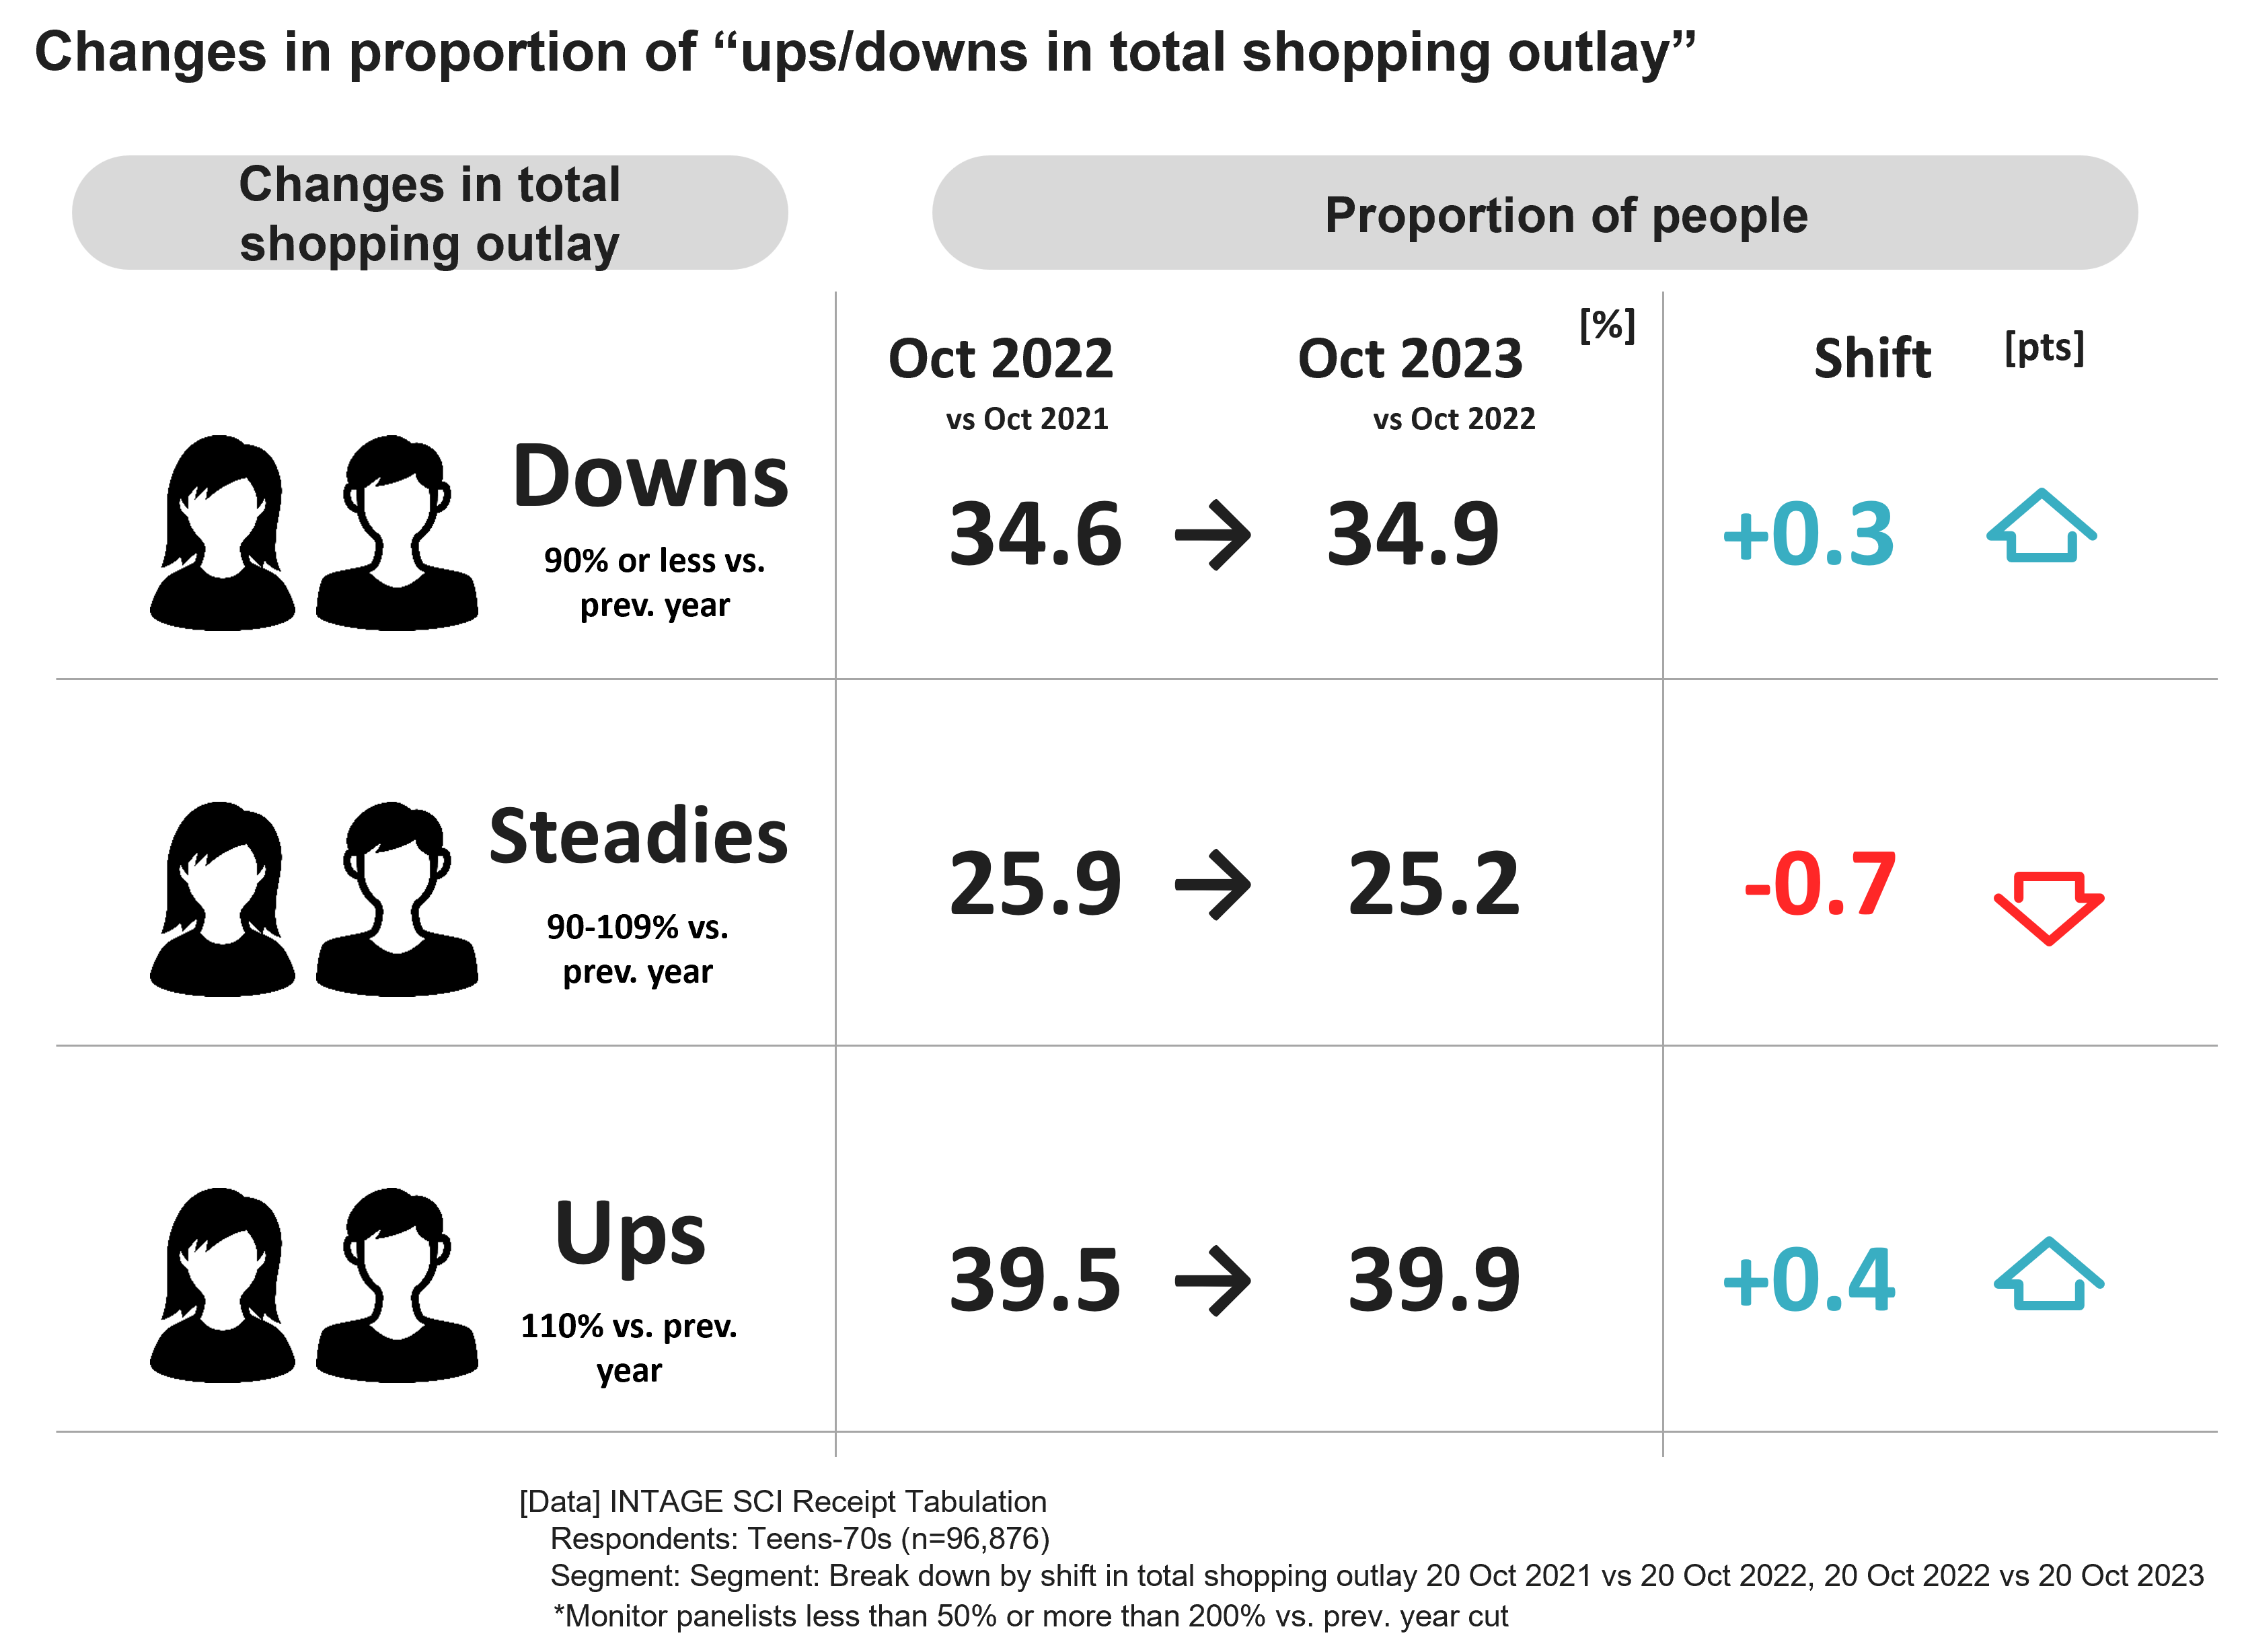
In terms of tabulation/analytical approach, we divided shifts in purchase value versus the same month in the previous year (October 2022 vs. October 2023) into a panel of 3 segments “Ups”, “Steadies”, and “Downs” in terms of increase and decrease, and then calculated their ratios. The result was that as of October 2023, 34.9% were “Downs”, 25.2% were “Steadies”, and 39.9% were “Ups”, with close to 40% “Ups” – the largest of the three segments.
On comparison with composition a year ago (October 2021 vs. October 2022), there were no sizable changes, with “Downs” shifting +0.3 points, “Steadies” -0.7 points, and “Ups” +0.4 points respectively (Fig 5). While efforts are underway to improve salaries and hourly wages through government wage increases, real wages have not year increased. This suggests economizing is not keeping up with prolonged price rises, with consumers thus being forced to increase spending.
Fig 5
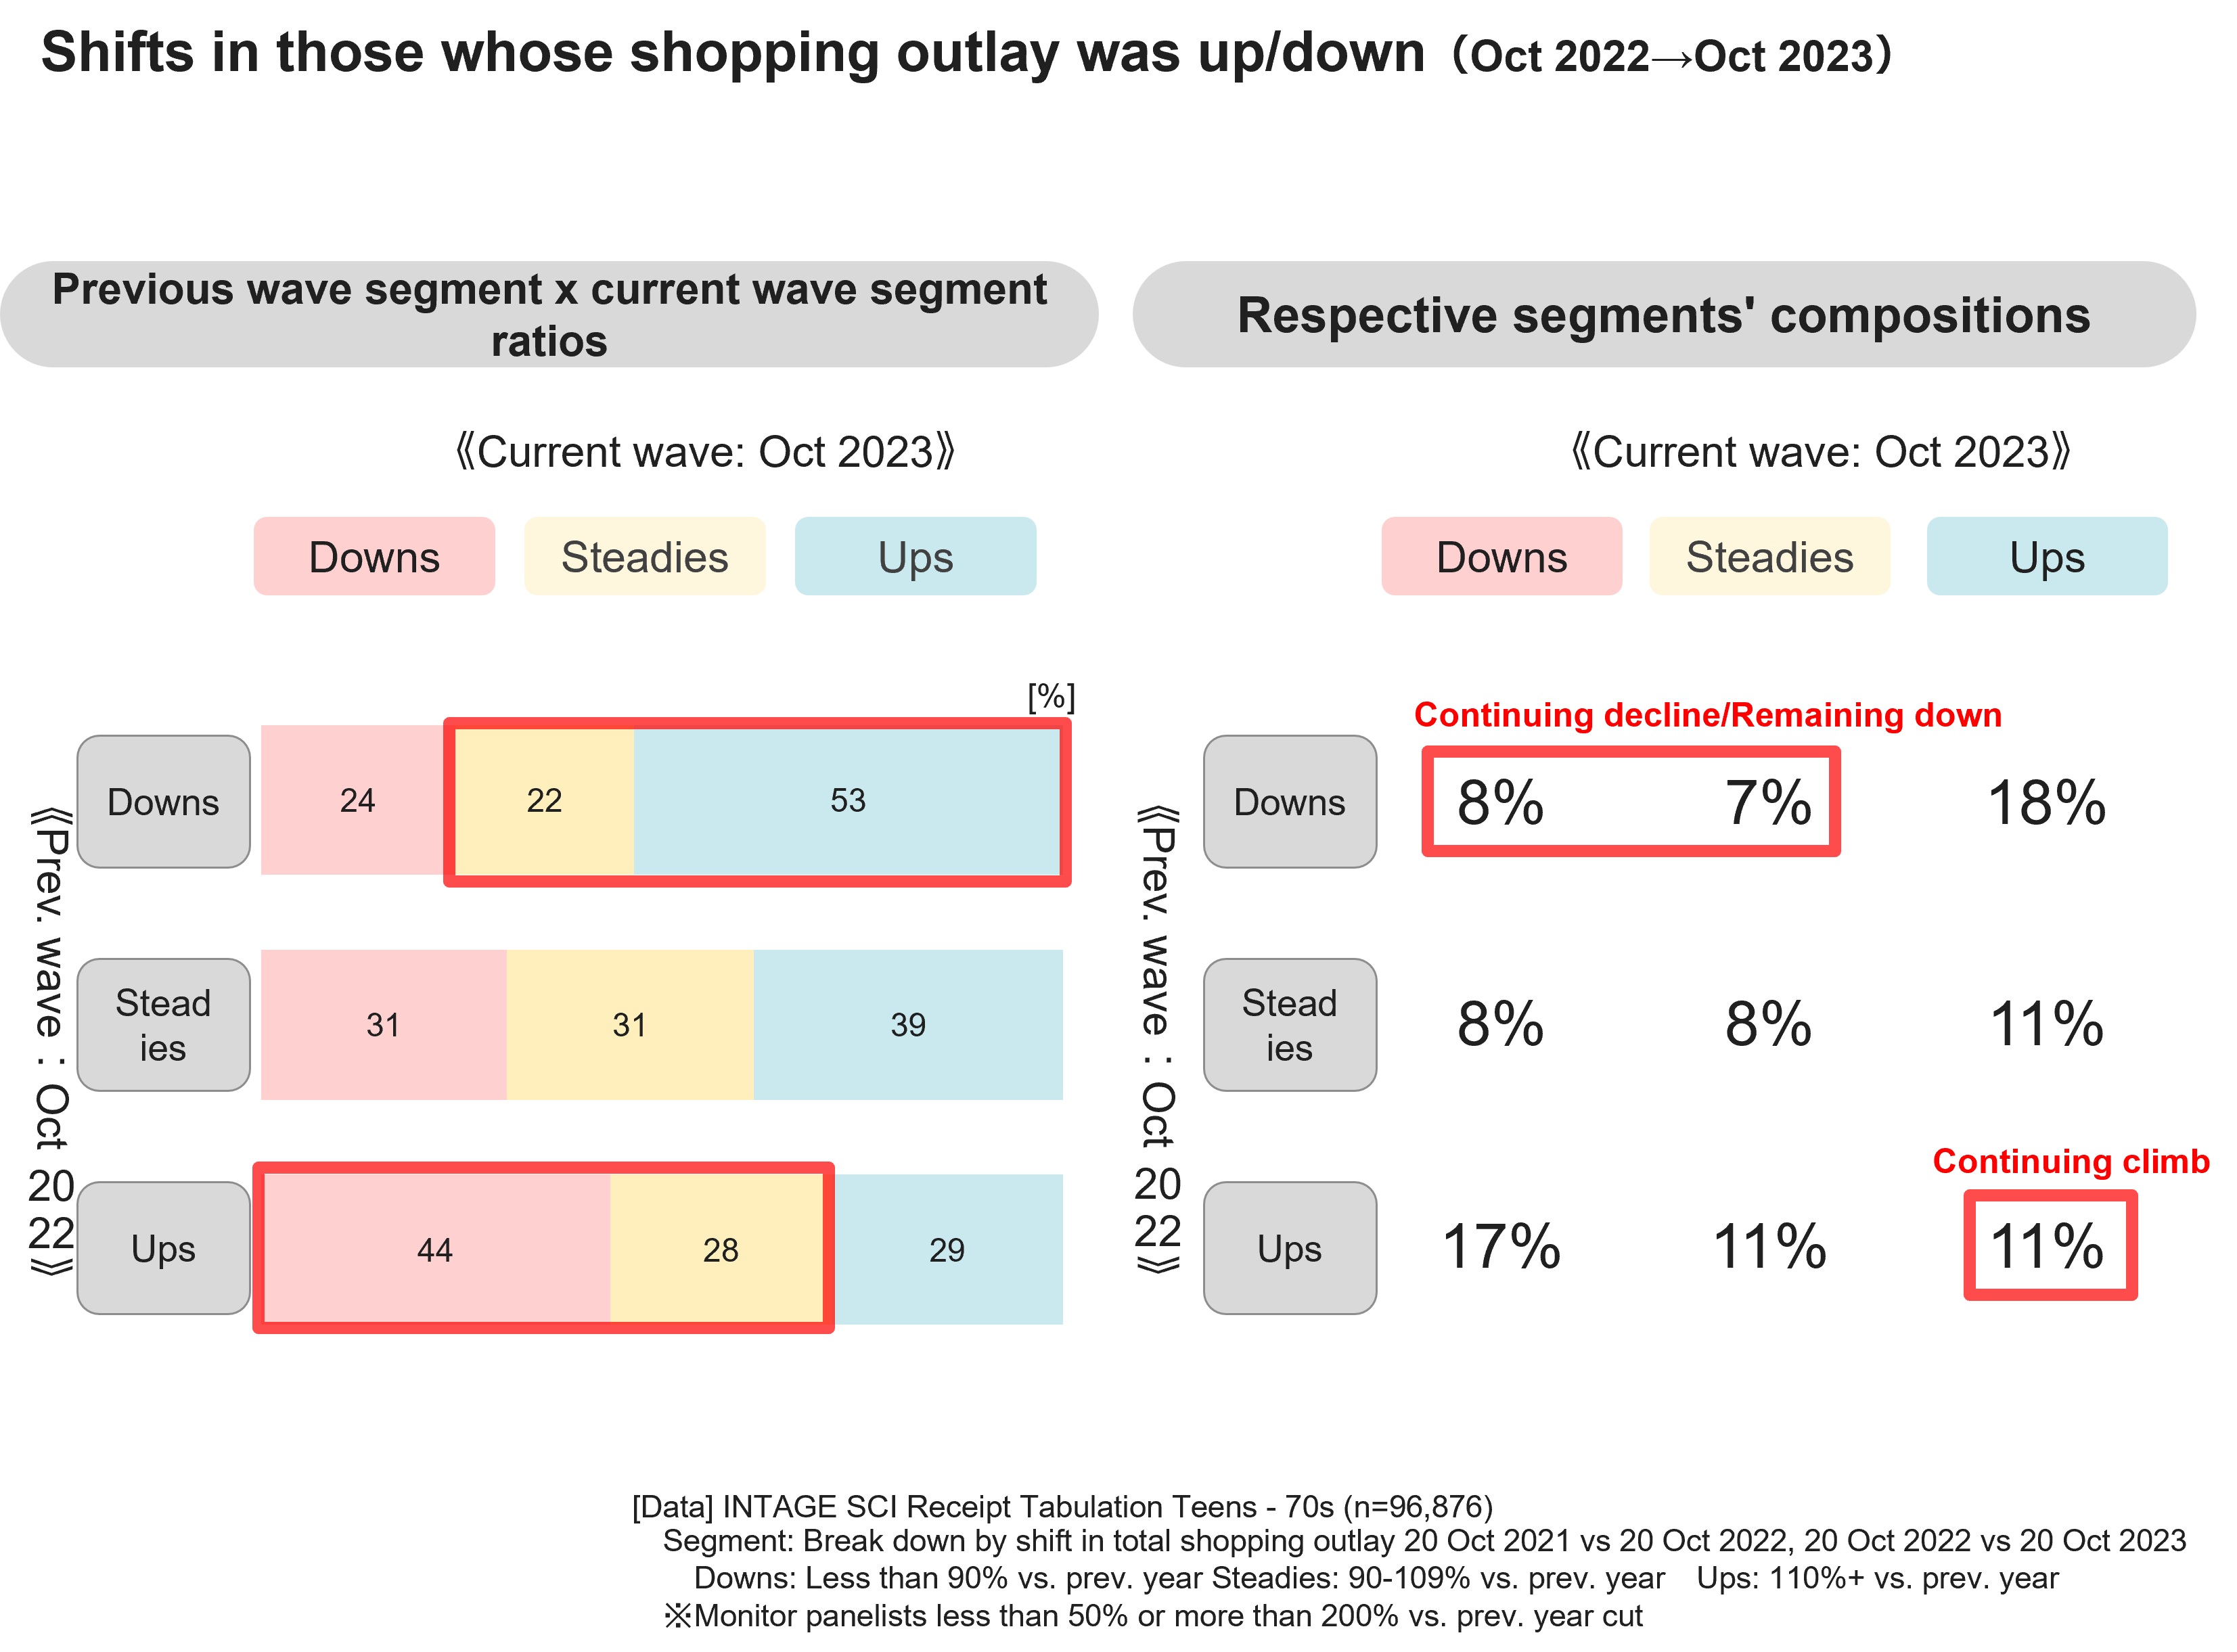
To what extent have the trends in terms of decreases and increases in spending observed among each segment in October 2021 to October 2022 become entrenched or changed in the 12 months following? The chart to left in Fig 6 depicts which segments the “Downs”, “Steadies”, and “Ups” in 2021 to 2022 became in 2022 to 2023.
Around 30% continued the same behavior as the previous wave, such as “Down→ Down” or “Up → Up” respectively. Conversely, a high around 70% of each segment switched, and were observed to change their outlook and behavior from a year ago. Just under half of those in the “Ups” segment in the previous wave changed to become “Downs” in the current wave, suggesting that even those who accepted the price increases in the previous wave= increased spending may have become conscious of economizing recently. Conversely, over half of those who were in the “Downs” segment in the previous wave changed to become “Ups” in the current wave. Since covid’s shift to a category 5 ailment, people appear to have increased spending on eating out etc. due to increased opportunities to go out with travel, events etc. It is also possible that efforts to guard household purse strings have been unable to keep up with ongoing price increases, leading to increased spending. And naturally, it may also be possible consumers are “growing tired of economizing”.
The chart to right in Fig 6 is the composition each segment among all consumers. A lack of awareness of economizing is still observed among only 11% of “Ups” in both the previous and current waves, indicating approximately 90% engaged in behavior with economizing in mind at some point between last year and this year. There were also 15% of stoic people who continued to economize from the previous wave as either “Down → Down” or “Down → Steady”.
Fig 6
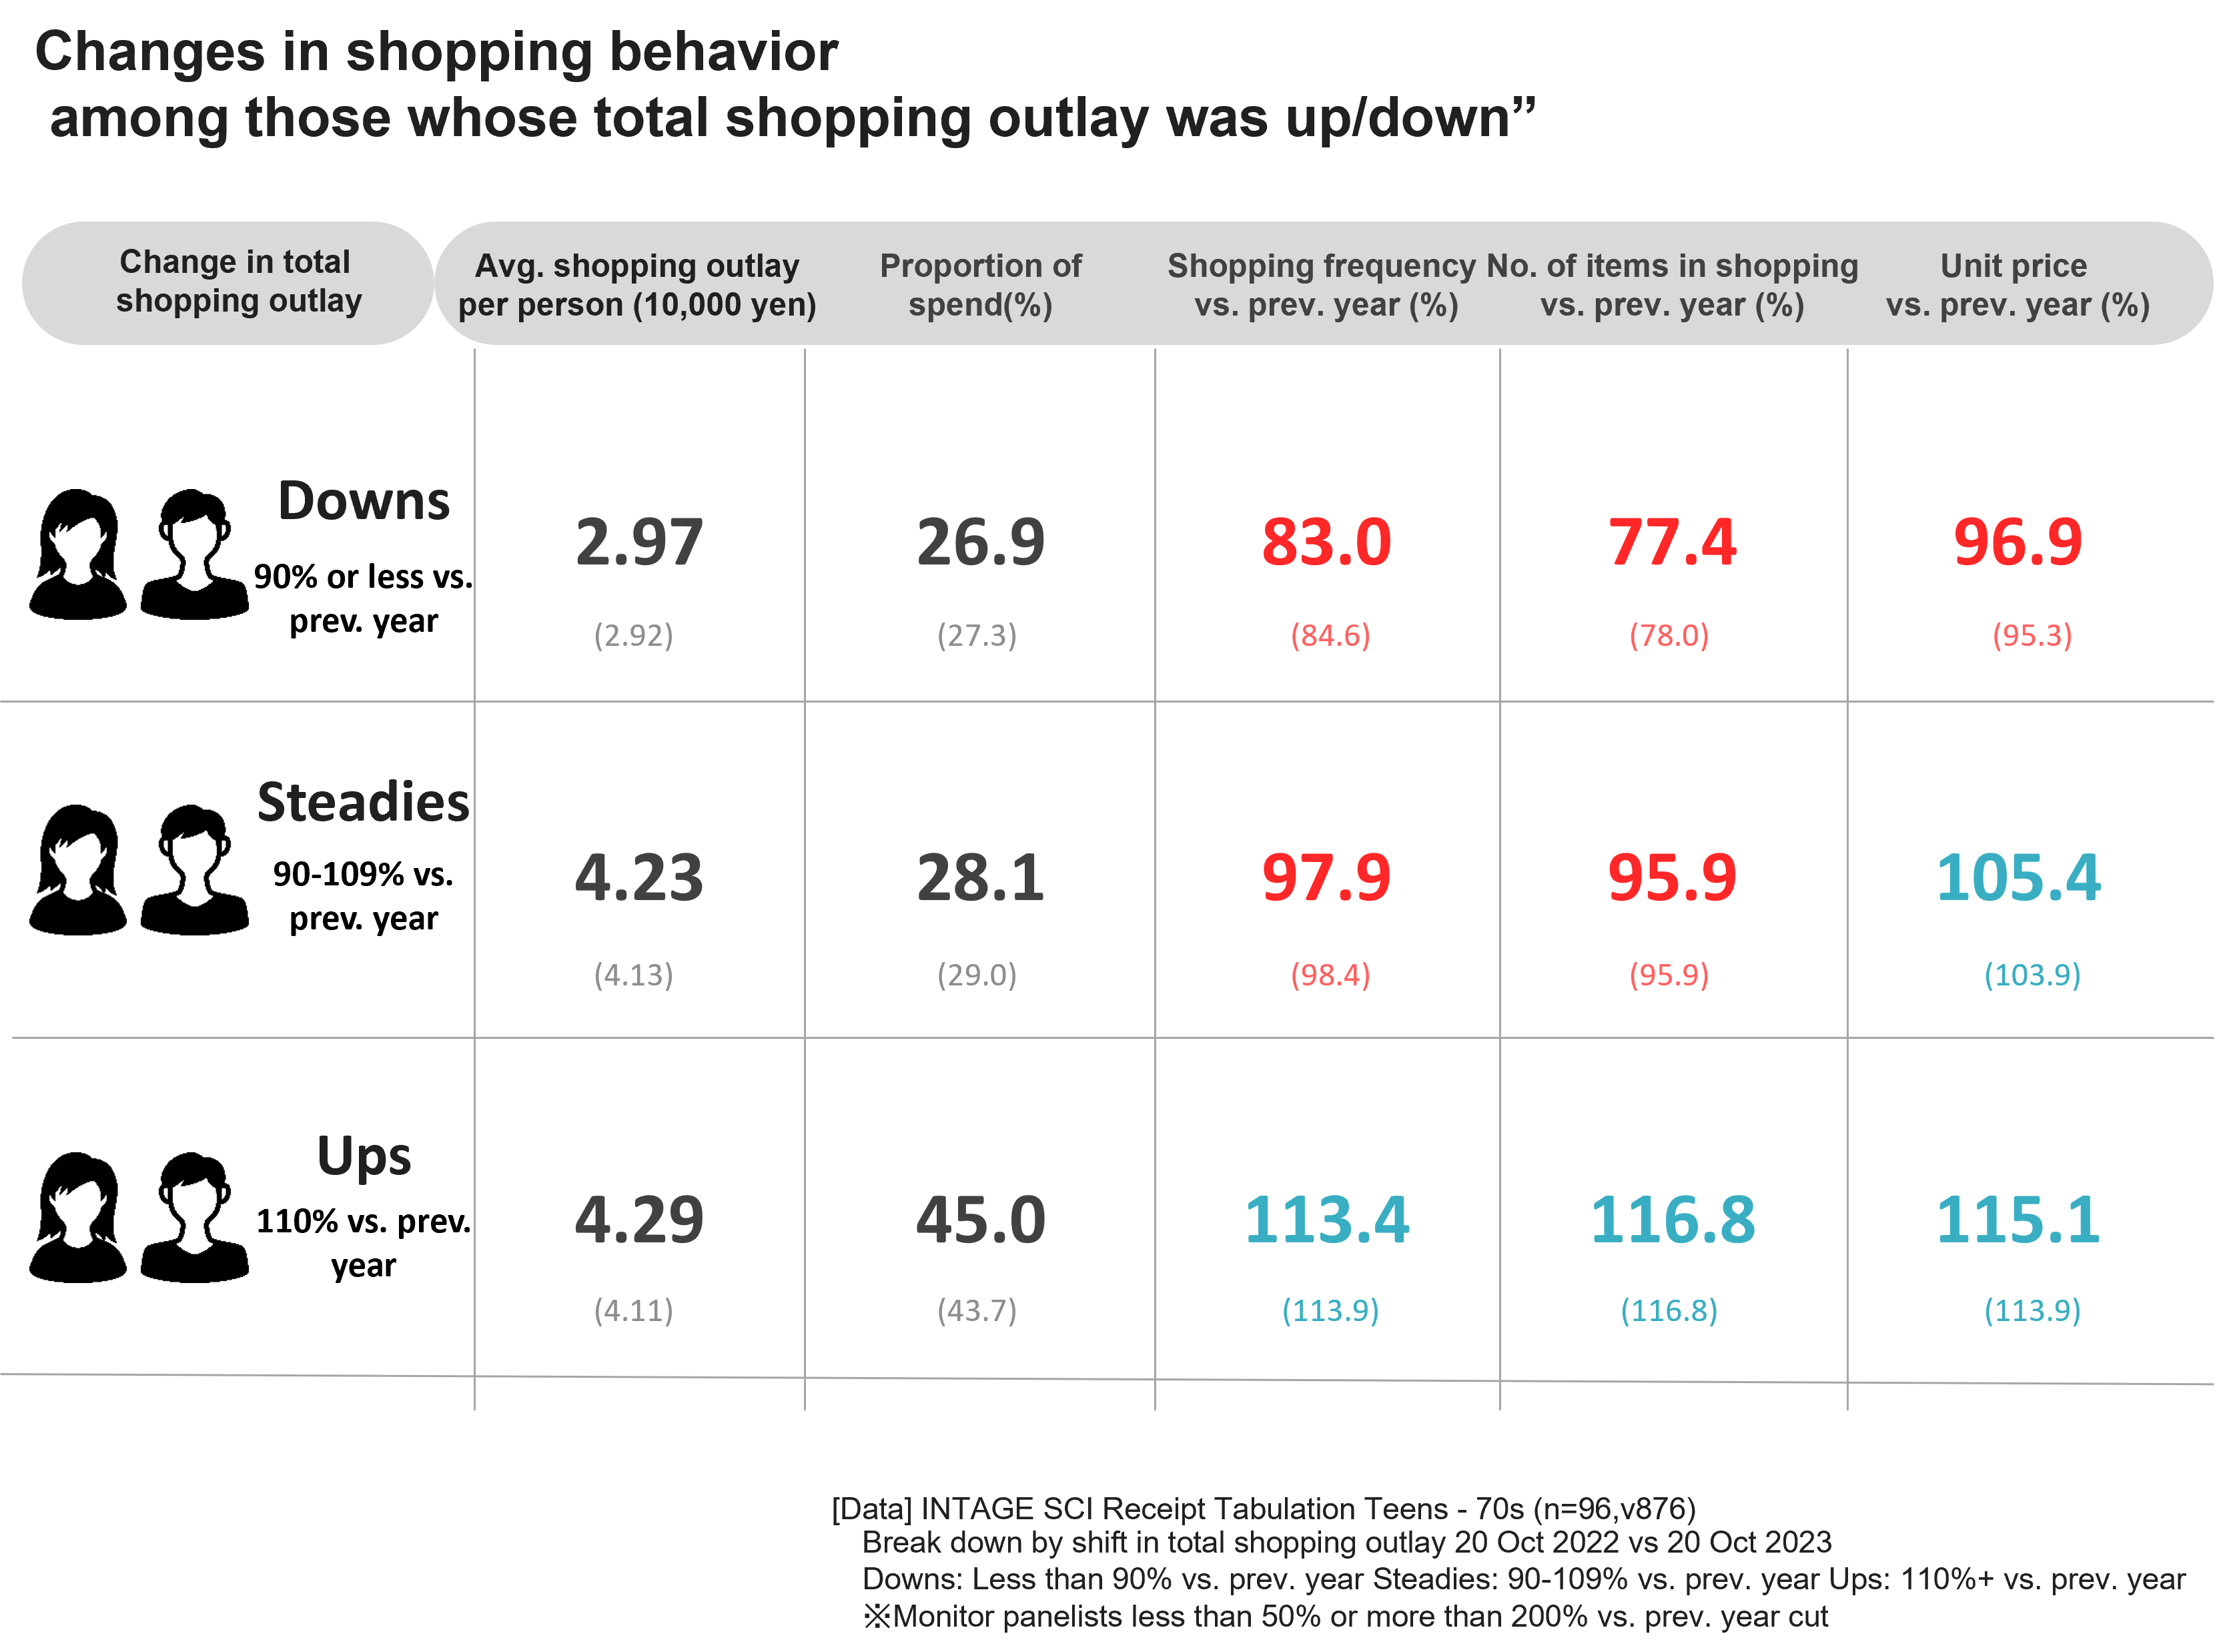
From this point onwards, let’s take a look at the characteristic sorts of shopping behavior each segment engages in based on the figures “shopping frequency”, “number of items in shopping”, and “shopping unit prices” (Fig 7).
On observation of the average purchase value per person, “Ups” (42,900 yen) and “Steadies” (42,300 yen) display a much higher volume of purchases than “Downs” (29,700 yen), a similar trend to last year. Similar initiatives to last year continue to be observed such as buying cheaper items, and reducing the number of items in shopping to compensate for the increase in unit prices. While people have switched between segments, each segment’s shopping behavior does not appear to have changed much.
To delineate each segment’s characteristic shopping behavior, the “Downs” use all kinds of methods, such as cutting down on shopping frequency or their number of items, as well as reducing unit prices. “Steadies” are accentuated, reducing shopping frequency and their number of items despite the increase in unit prices to keep spending on par with last year. “Ups” unit prices increased 15%, and also increased shopping frequency/their number of items.
Fig 7
3. Signs of polarization in consumption – are those spending more free from holding off now?
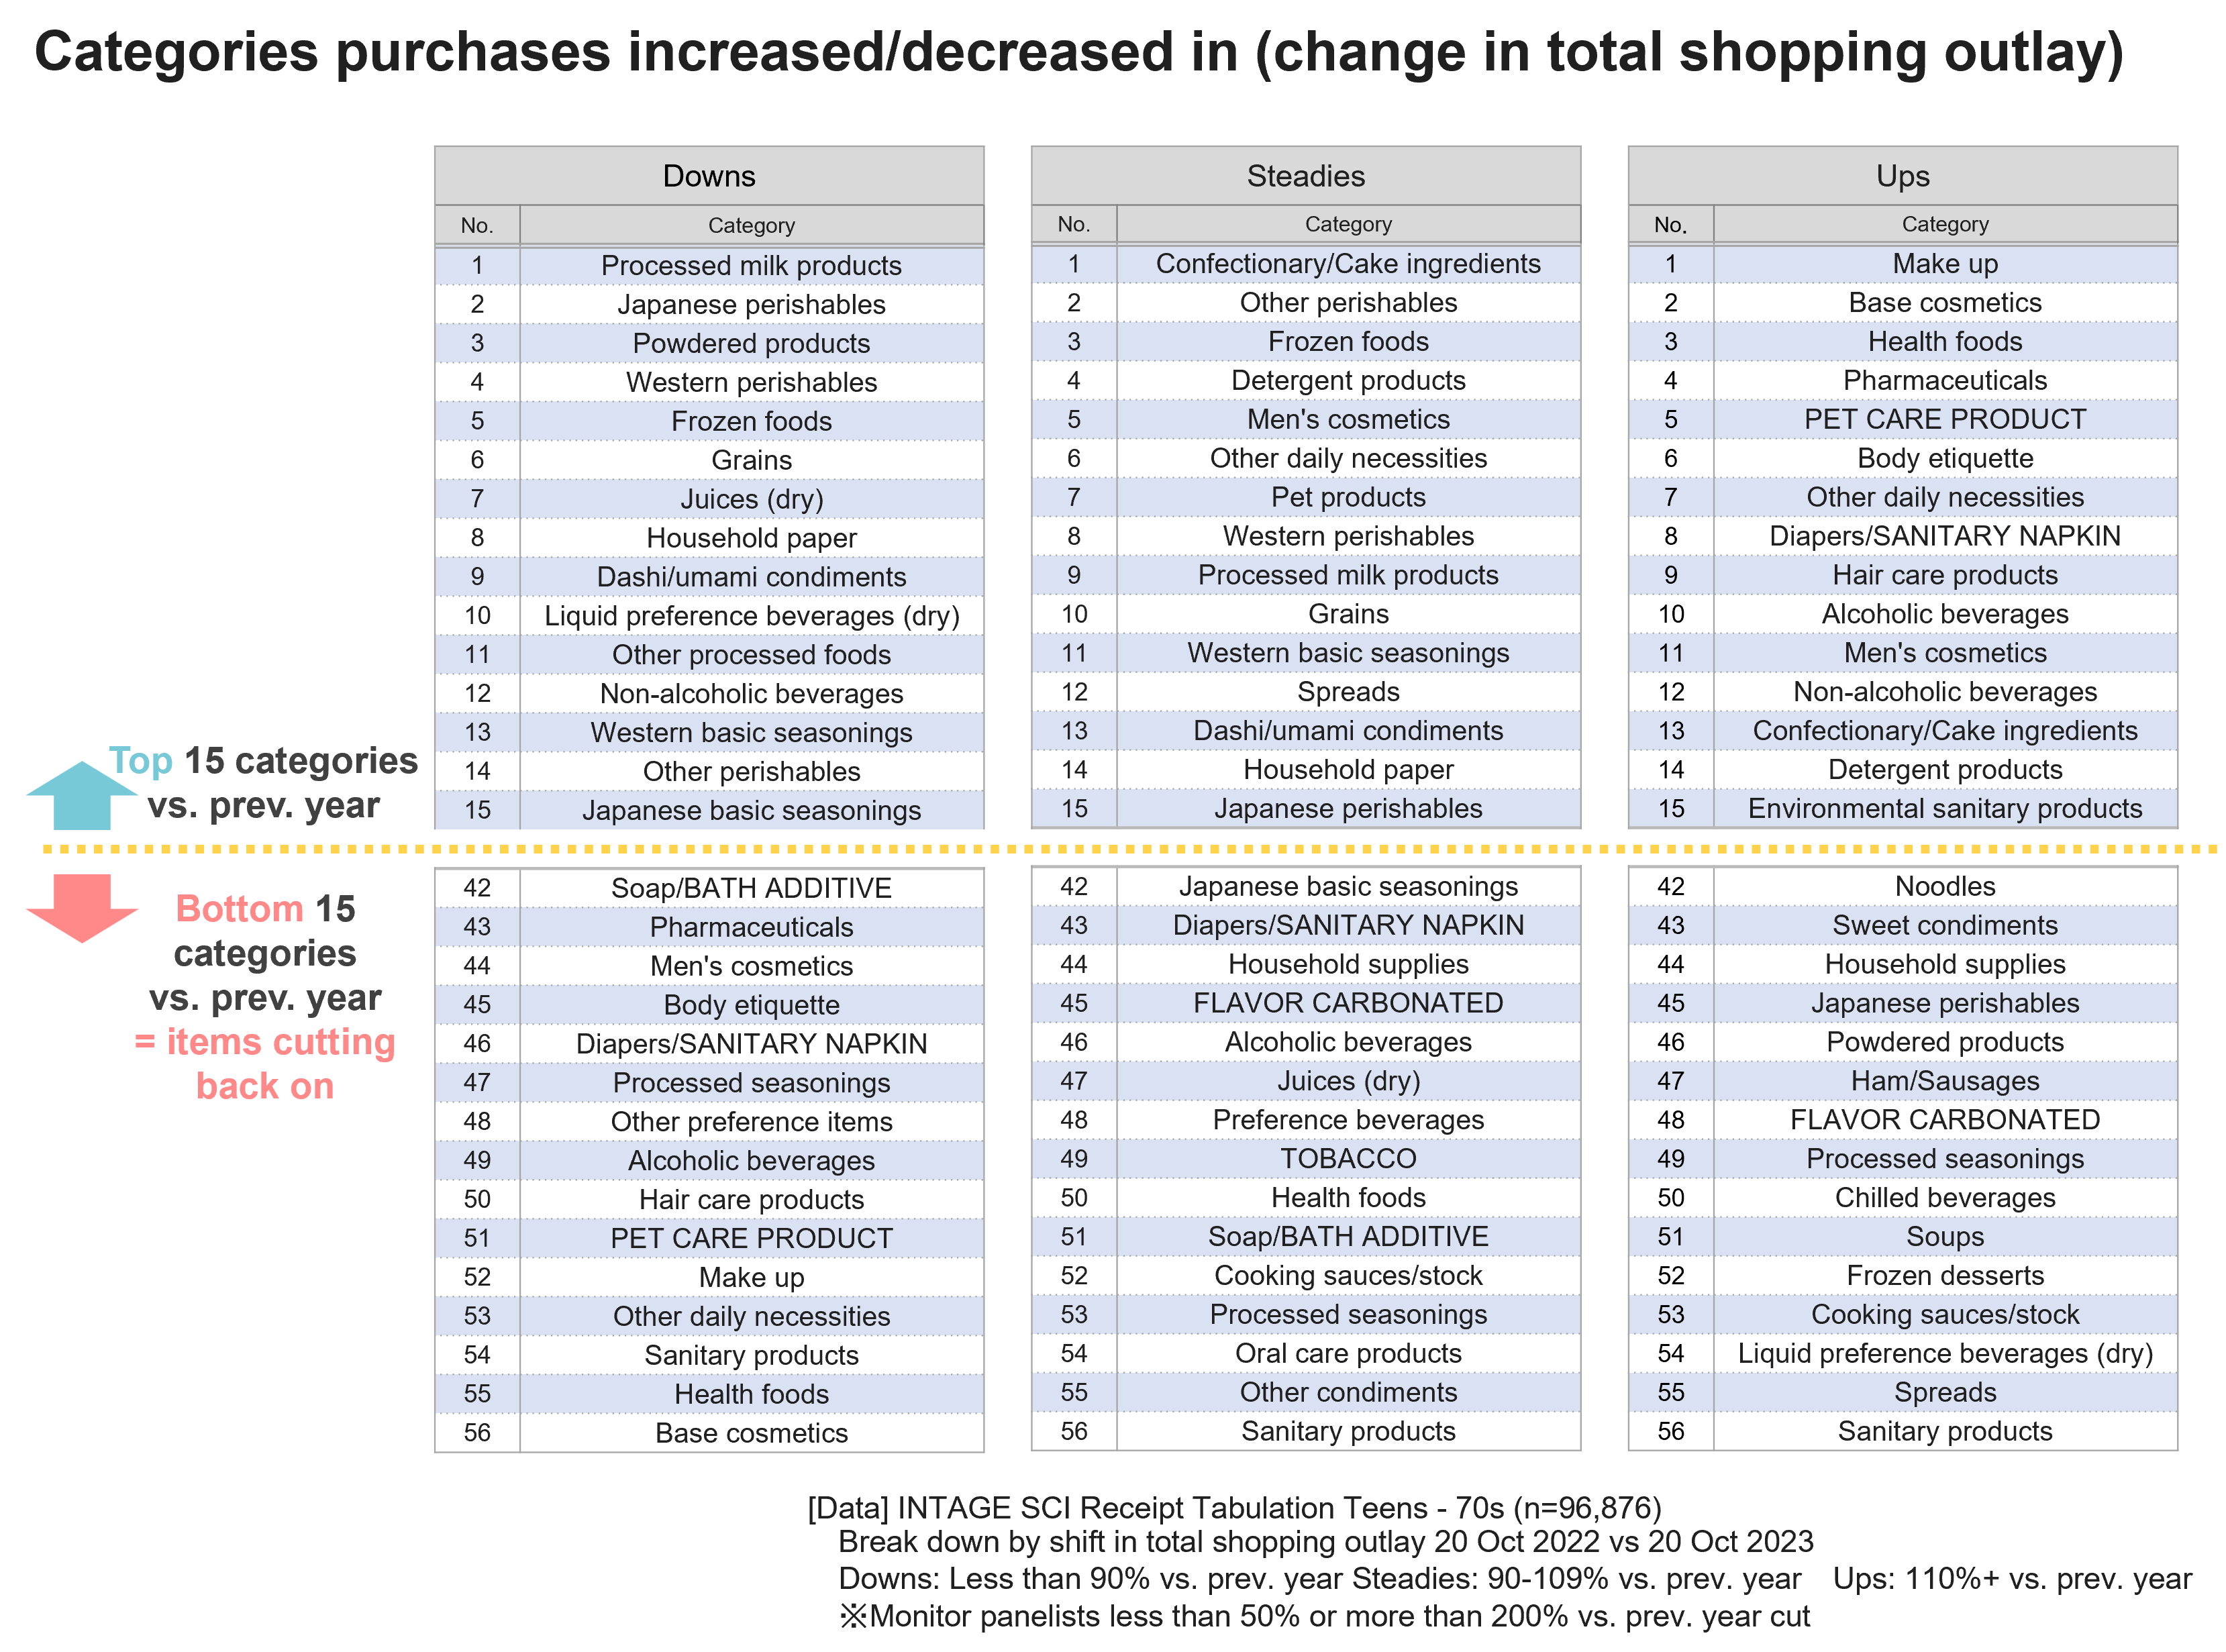
Next, let’s analyze the changes in each segment’s purchase value in more detail at the category level (Fig 8). “Downs” cut back on “cosmetics”, “hair care”, “health foods”, and “alcohol” akin to the previous wave. They also cut back slightly on “groceries”. Conversely, “Ups” dramatically increased on the categories “Downs” cute back on – “cosmetics”, “hair care”, “health foods”, and “alcohol”. They appear to be purchasing the things they held off purchasing last year due to price increases.
Fig 8
4. Are private brands going to save the day with guarding the household purse strings?
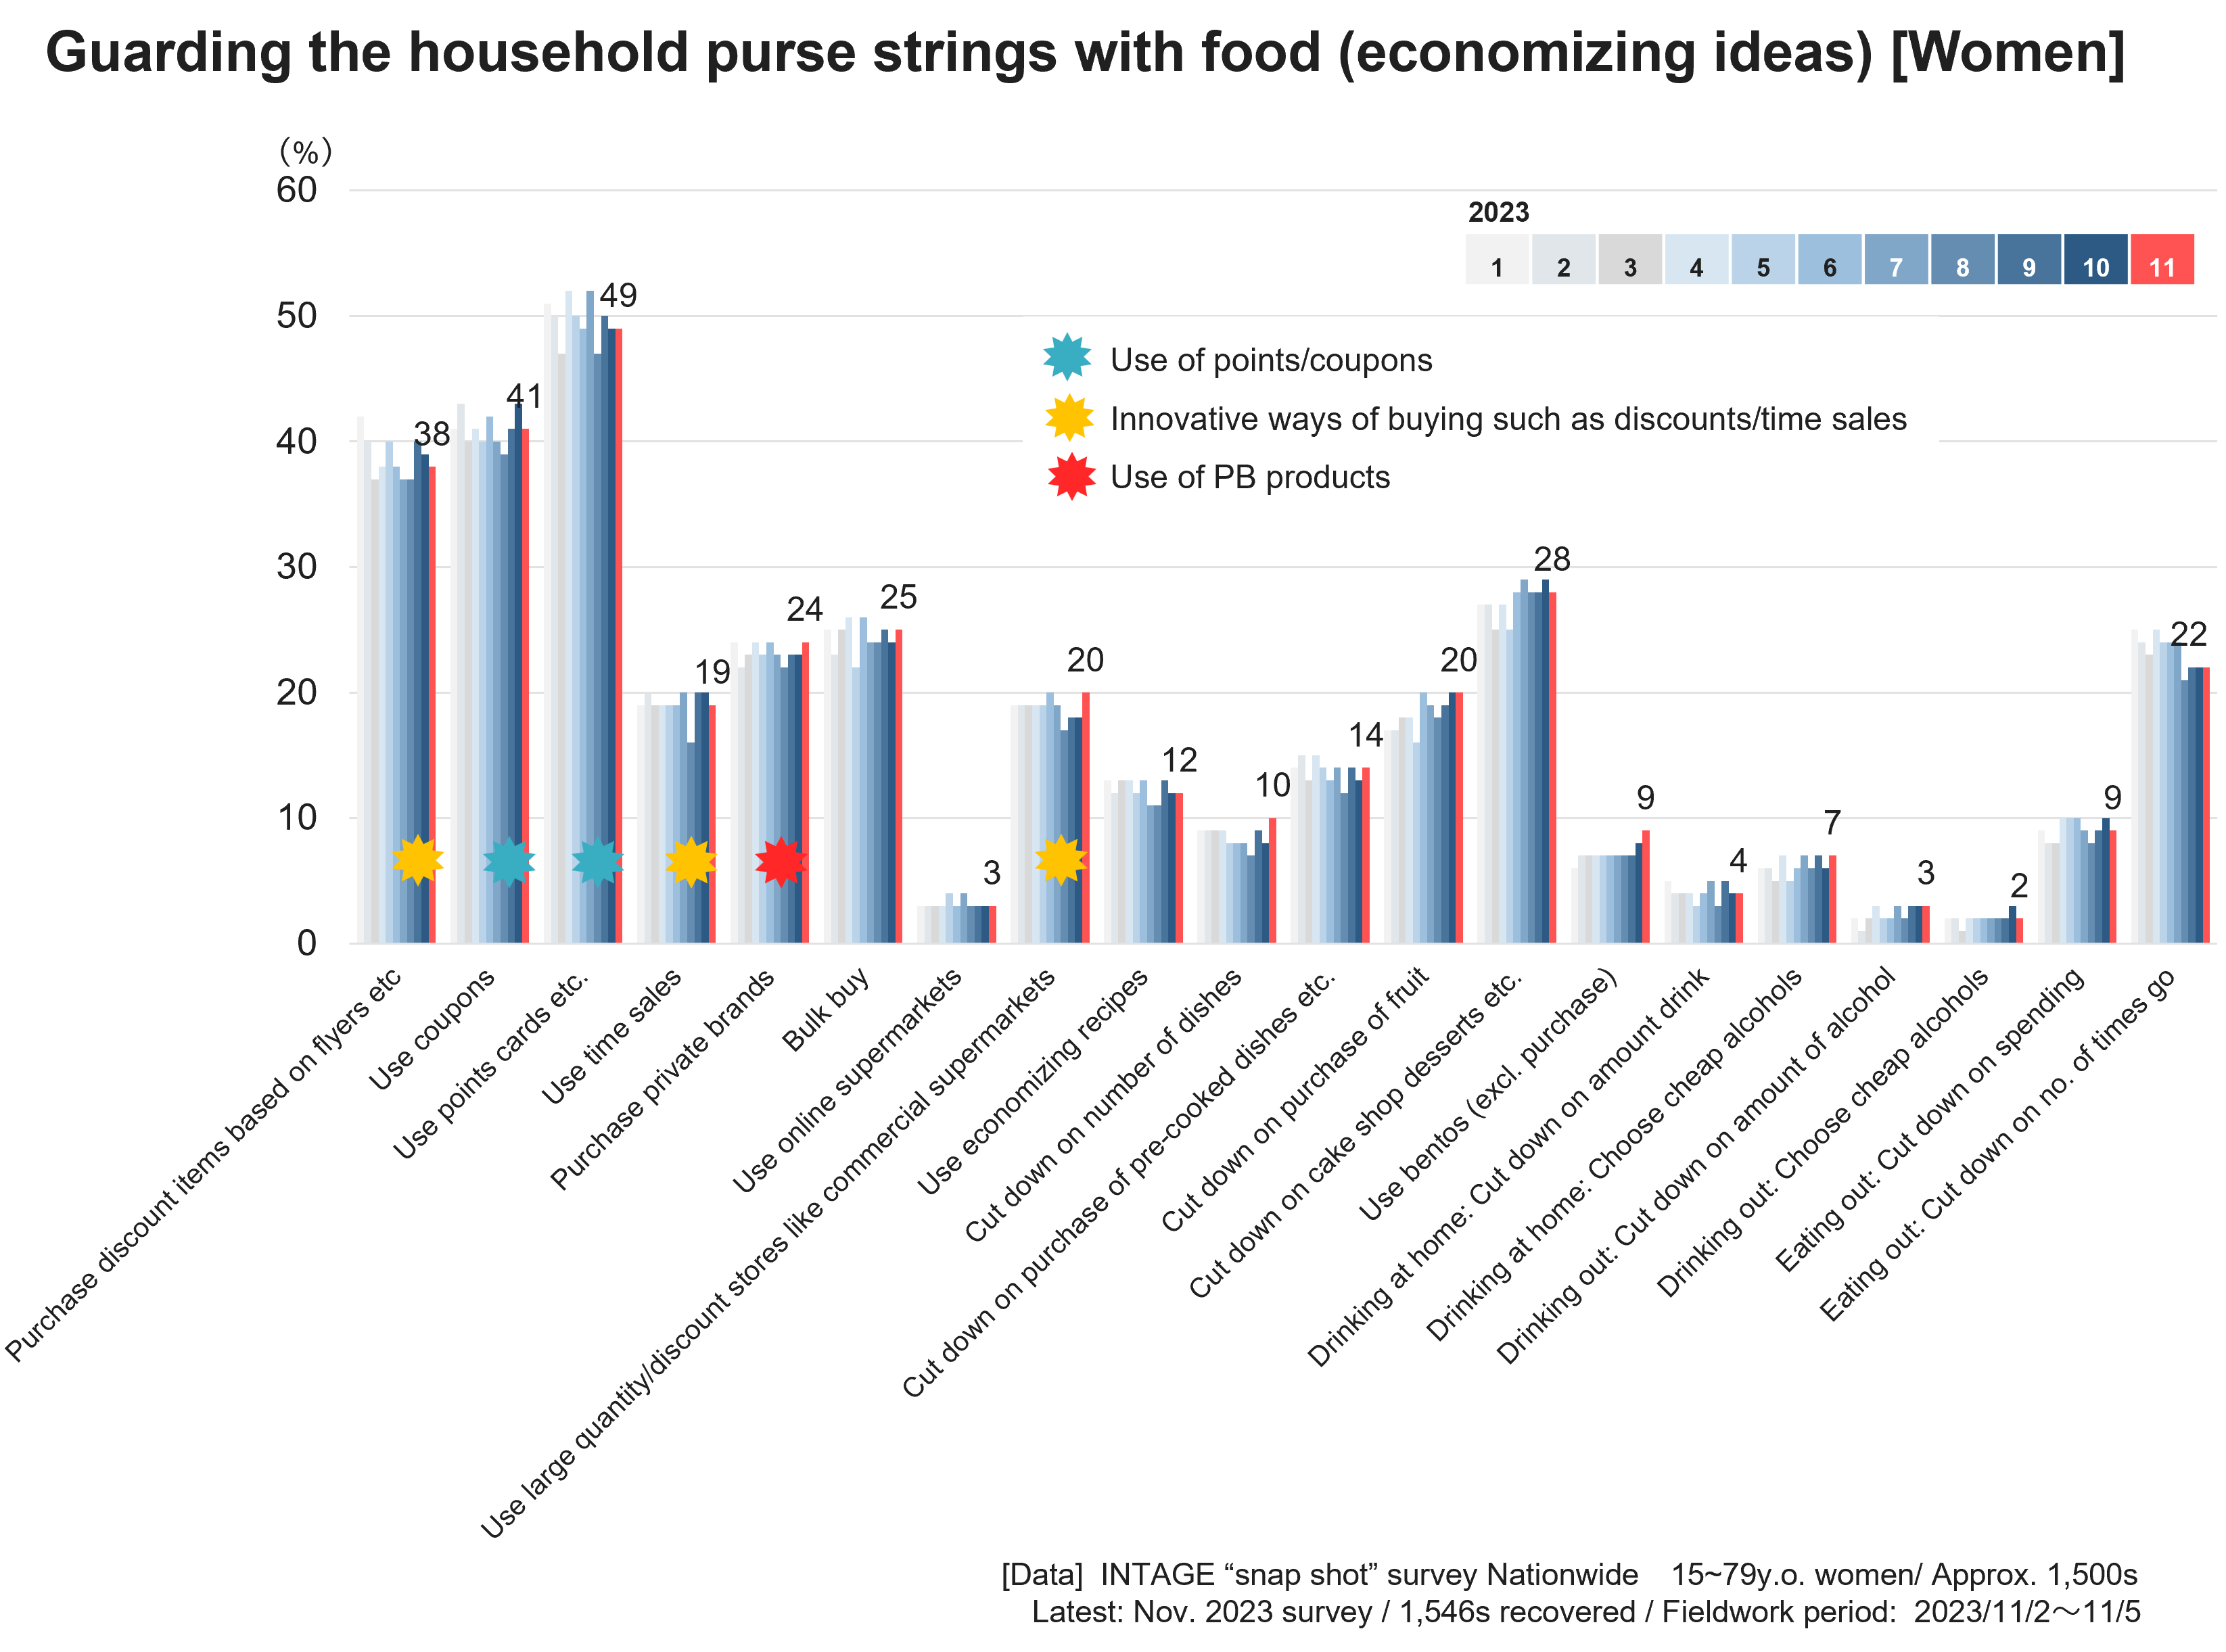
In an INTAGE fixed-point survey, purchasing as affordably as possible, such as through using “point cards” and “coupons”, purchasing items on special and bulk buying were cited as means to guard the household purse strings, with savvy use of “private brands (PB)” also mentioned. It has also been on an upward trend over the past few months as a countermeasure against groceries-related price increases (Fig 9).
Fig 9
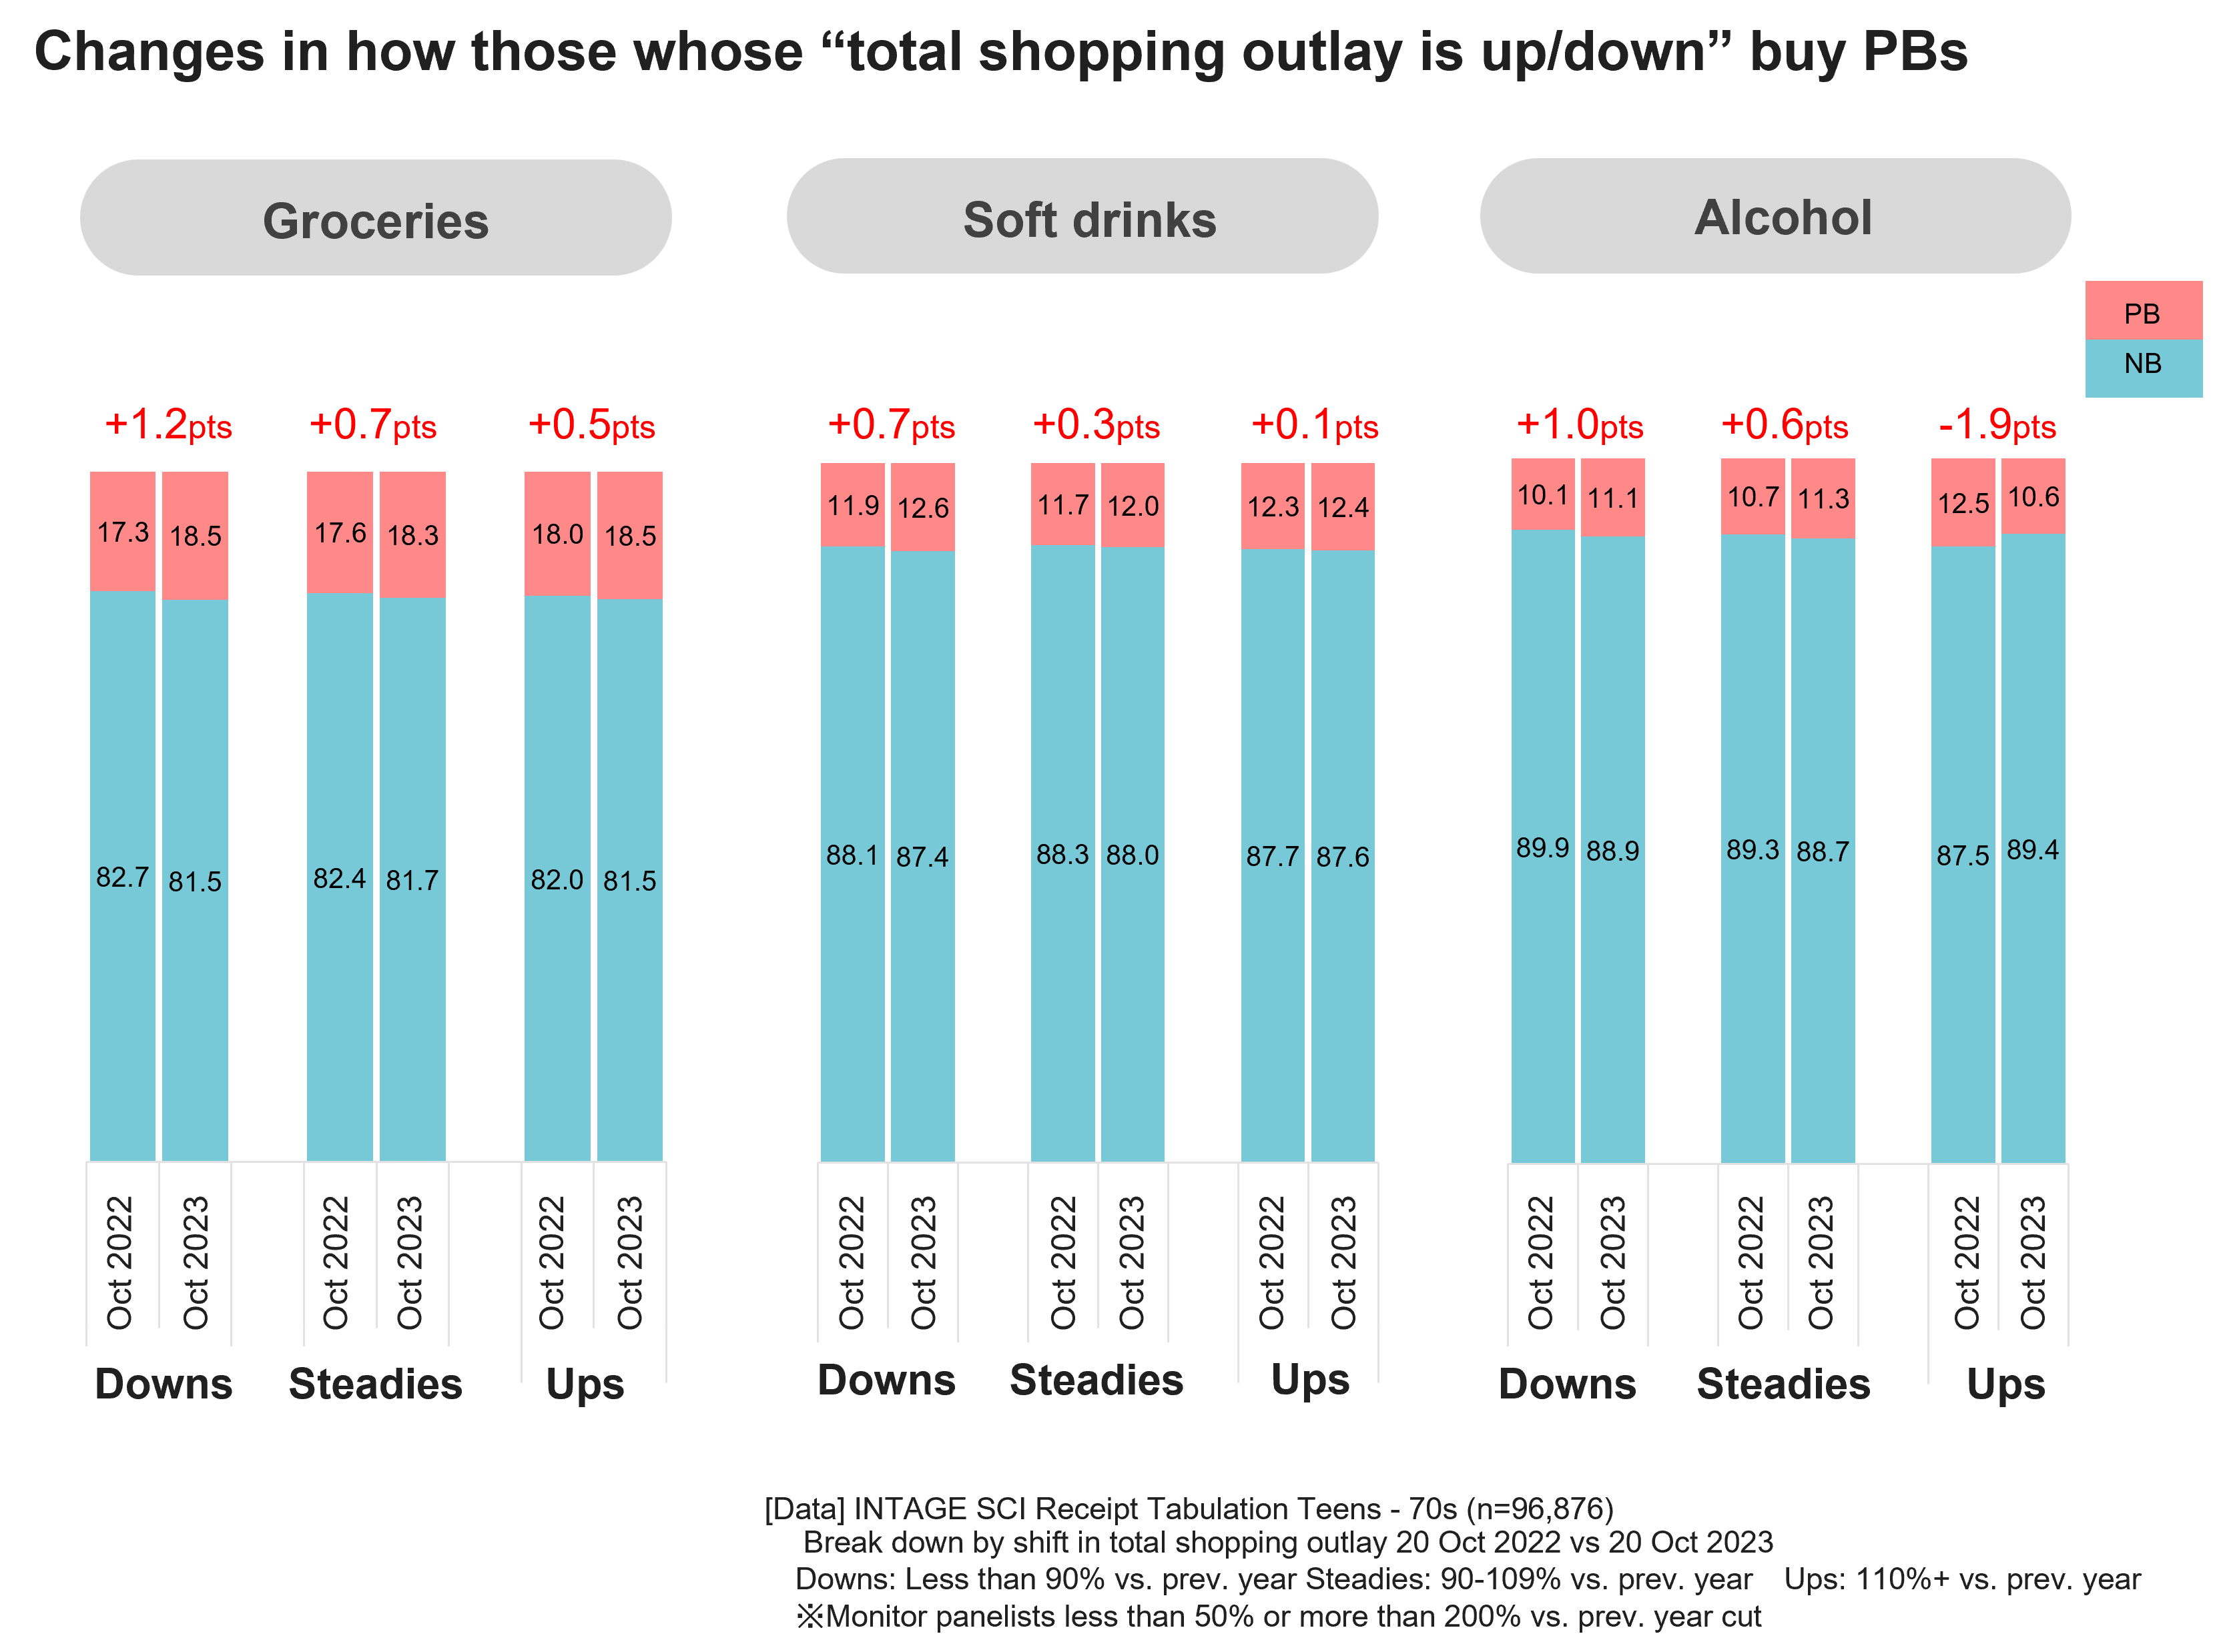
Next, let’s take a look at shifts in “PB usage” with the three categories “groceries”, “soft drinks”, and “alcohol” based on purchase history data (Fig 9). Overall, the PB ratio has increased compared to last year, with this increase much more sizable among the “Downs” than the other segments. PBs may serve as a strong ally to help “Downs” overcome the world of rising prices. In addition, among the “Ups”, the ratio of NB (national brand) increased. While the purchase value of alcohol itself increased sizably, it may also be possible that in reaction to ongoing belt tightening, they are purchasing NB products, which are relatively more expensive than PB products.
While a shift to (relatively priced) PB is occurring centering on the “Downs”, PB products themselves are becoming more value added and more expensive. They sometimes appear on the dinner table at my house as well, and we find a certain PB brand’s beef stew etc. really delicious, with it now one of our favorites. Considering these trends, private brand products can be said to possess the potential to spread further among both “Downs” and “Ups”.
Fig 10
We would like to continue to follow consumer trends in future from both a consciousness and purchase behavior perspective.
5. Wrap up: Dialogue between analysts
Finally, we asked the members in charge of this analysis their thoughts.
Hiromasa Tanaka, Consumer Research Center (herein referred to as Tanaka):What are your impressions/thoughts on the shift of Downs, Steadies, and Ups?
Ei Hashimoto, CBD Headquarters Planning/Analysis Division 5 (herein referred toas Hashimoto):Since Down→ Up was the largest in terms of composition, I think this may reflect consumers “getting used to price increases” and “growing tired of economizing”. During the covid crisis, people initially economized out of economic concerns, and in 2022, economization mode took off due to the clear price increase trend, and has remained this way all this time… I’m also tired of it…
Kyoko Nagai, CBD Headquarters Planning/Analysis Division 5 (herein referred to as Nagai):I also had Tanaka-san’s article, “Signs of acclimatization to price increases and growing tired of economizing – Consumer snapshot Vol. 5” that appeared in Shiru Gallery last time in mind while I conducted the analysis this time, an read the data thinking “oh, yeah, that’s right, they are tired of economizing”.
Hashimoto:I was shocked that there were more people that I had expected seriously engaged in belt tightening in this age of rising prices, such as Down→ Down, Down→ Steady, and Steady → Down. I felt I could hear voices saying “Life is hard” from the data…
Tanaka:What were your impressions/thoughts upon seeing the rankings of items purchased by each segment?
Saho Yamada, CBD Headquarters Planning/Analysis Division 5 (herein referred to as Yamada): The top item for Ups are cosmetics, which are an outward-looking category for people who want to be beautiful/cute, and health foods, which seems to be indicative of heightened health consciousness, and the need to be healthy if you are going out, and put me in a cheerful mood since it seemed like the covid crisis is really over.
Nagai:After seeing that dairy products ranked first versus the previous year among Downs, a dairy manufacturer apparently said “I’m relieved people consider yoghurt a necessity”. When you look at this sort of data, it becomes apparent there are things people can’t do without, even when engaging in accentuated shopping.
Tanaka:That’s certainly true, isn’t it? Next, what do you think will happen with private brands in future?
Hashimoto:This is a trend that is currently unfolding, but I think private brands will also polarize, into premium-type private brands and economy private brands. At the same time, I think that “lesser-known national brands” that are cheaper than private brands may cause trouble for better-known major national brands and private brands.
Nagai:In the industries I’m in charge of, this is true for carbonated water etc. The sorts of national brands people have never seen before available at commercial supermarkets and discount stores are much cheaper, and are selling much more than convenience store or supermarket private brands. People who are really striving to economize are buying them rather than private brands, aren’t they?
Yamada:During the covid crisis, the use of drugstores and commercial supermarkets etc. increased, which has caused supermarkets to struggle. However, people appear to increasingly be of the mindset they are “tired of going around searching for cheap stores” due to growing tired of economizing.
Tanaka:I hope you continue examining consumers’ lives from the perspective of shopping data, and report on the current status quo from the sorts of unique perspectives we looked at this time. I’m looking forward to it!
We will continue to analyze data together and report on changes and trends going forward. See you next time!
End
Author profile
Hiromasa Tanaka, Director, Consumer Research Center
Joined advertising agency-affiliated research firm in 1992. Participated as a founding member with a consumer database for the parent company advertising agency from 1994. From then until 2012, he was stationed in the advertising agency’s consumer research and advertising communication planning section, where he supported projects based on data-based consumer understanding in advertising communication planning and product/service development. During this time, he was responsible for a variety of areas, including FMCGs, DCGs, and services.
Fascinated by TV commercial footage and copy since his teens, he used to just record commercials and play them back time and again. If he had to choose some memorable ads, he would unhesitatingly give “1983 Suntory Royal Rambo ad (ad agency: Dentsu)” and “2004: Nescafe Shuntaro Tanikawa Morning Relay Sky ad (ad agency: McCann Erickson”. His hobbies include bicycling (road and mountain biking) and watching
Reproduction and Quotation
◆This report is copyrighted by INTAGE Inc. Please check the following prohibitions and precautions, and specify the source when reproducing or quoting this report. “Source: INTAGE “Knowledge Gallery” article published MM/DD/YYYY article”
◆The following are prohibited: ・Alteration of this article in full or in part ・Sale or publication of this article in full or in part ・Uses that are against public order and morality, and uses connected with illegal activities ・Reproducing or quoting panel data* for the purpose of advertising or promoting companies, products, or services *Panel data include: SRI+, SCI, SLI, Kitchen Diary, Car-kit, MAT-kit, Media Gauge, i-SSP, etc.
◆Other precautions: ・INTAGE Inc. shall not be liable for any trouble, loss, or damage caused by the use of this report ・These usage rules do not restrict the use of quotations or other uses permitted under the Copyright Act of Japan
◆For inquiries about reproduction and quotation, click here