Benchmark surveys and other questionnaire surveys such as tracking surveys and brand status surveys (henceforth referred to as benchmark surveys) are conducted regularly by many businesses and companies. The objectives of these surveys vary, but they are typically conducted with the following aims:
To ascertain changes in consumer awareness in the company’s own product category
To understand market trends in the company’s own product category
To ascertain consumer attitudes toward the company’s brand and competitor brands
The findings of these surveys are often treated as basic reference data for marketing strategy development.
In order to achieve the objective of tracking changes and trends, benchmark surveys have the following characteristics:
They are conducted on a regular basis during a specific time frame
The basic survey design remains unchanged
The survey is designed to give a bird’s-eye view of the market, with no bias toward any particular product or brand
Due to these characteristics, however, implementing the survey can become an end in itself, and in the absence of any major changes in the market, it can be difficult to leverage the findings to raise issues or take specific actions.
Benchmark Surveys: Key Components and Issues
Many benchmark surveys clarify changes in consumer attitudes from awareness to purchase (via a “funnel”). Implications for business growth are made by finding the factors that contribute to the increase or decrease in the number of people who are aware of the product or intend to purchase it. When discussing such findings, it is often assumed that raising awareness is the starting point for business growth, but there is more to it than that.
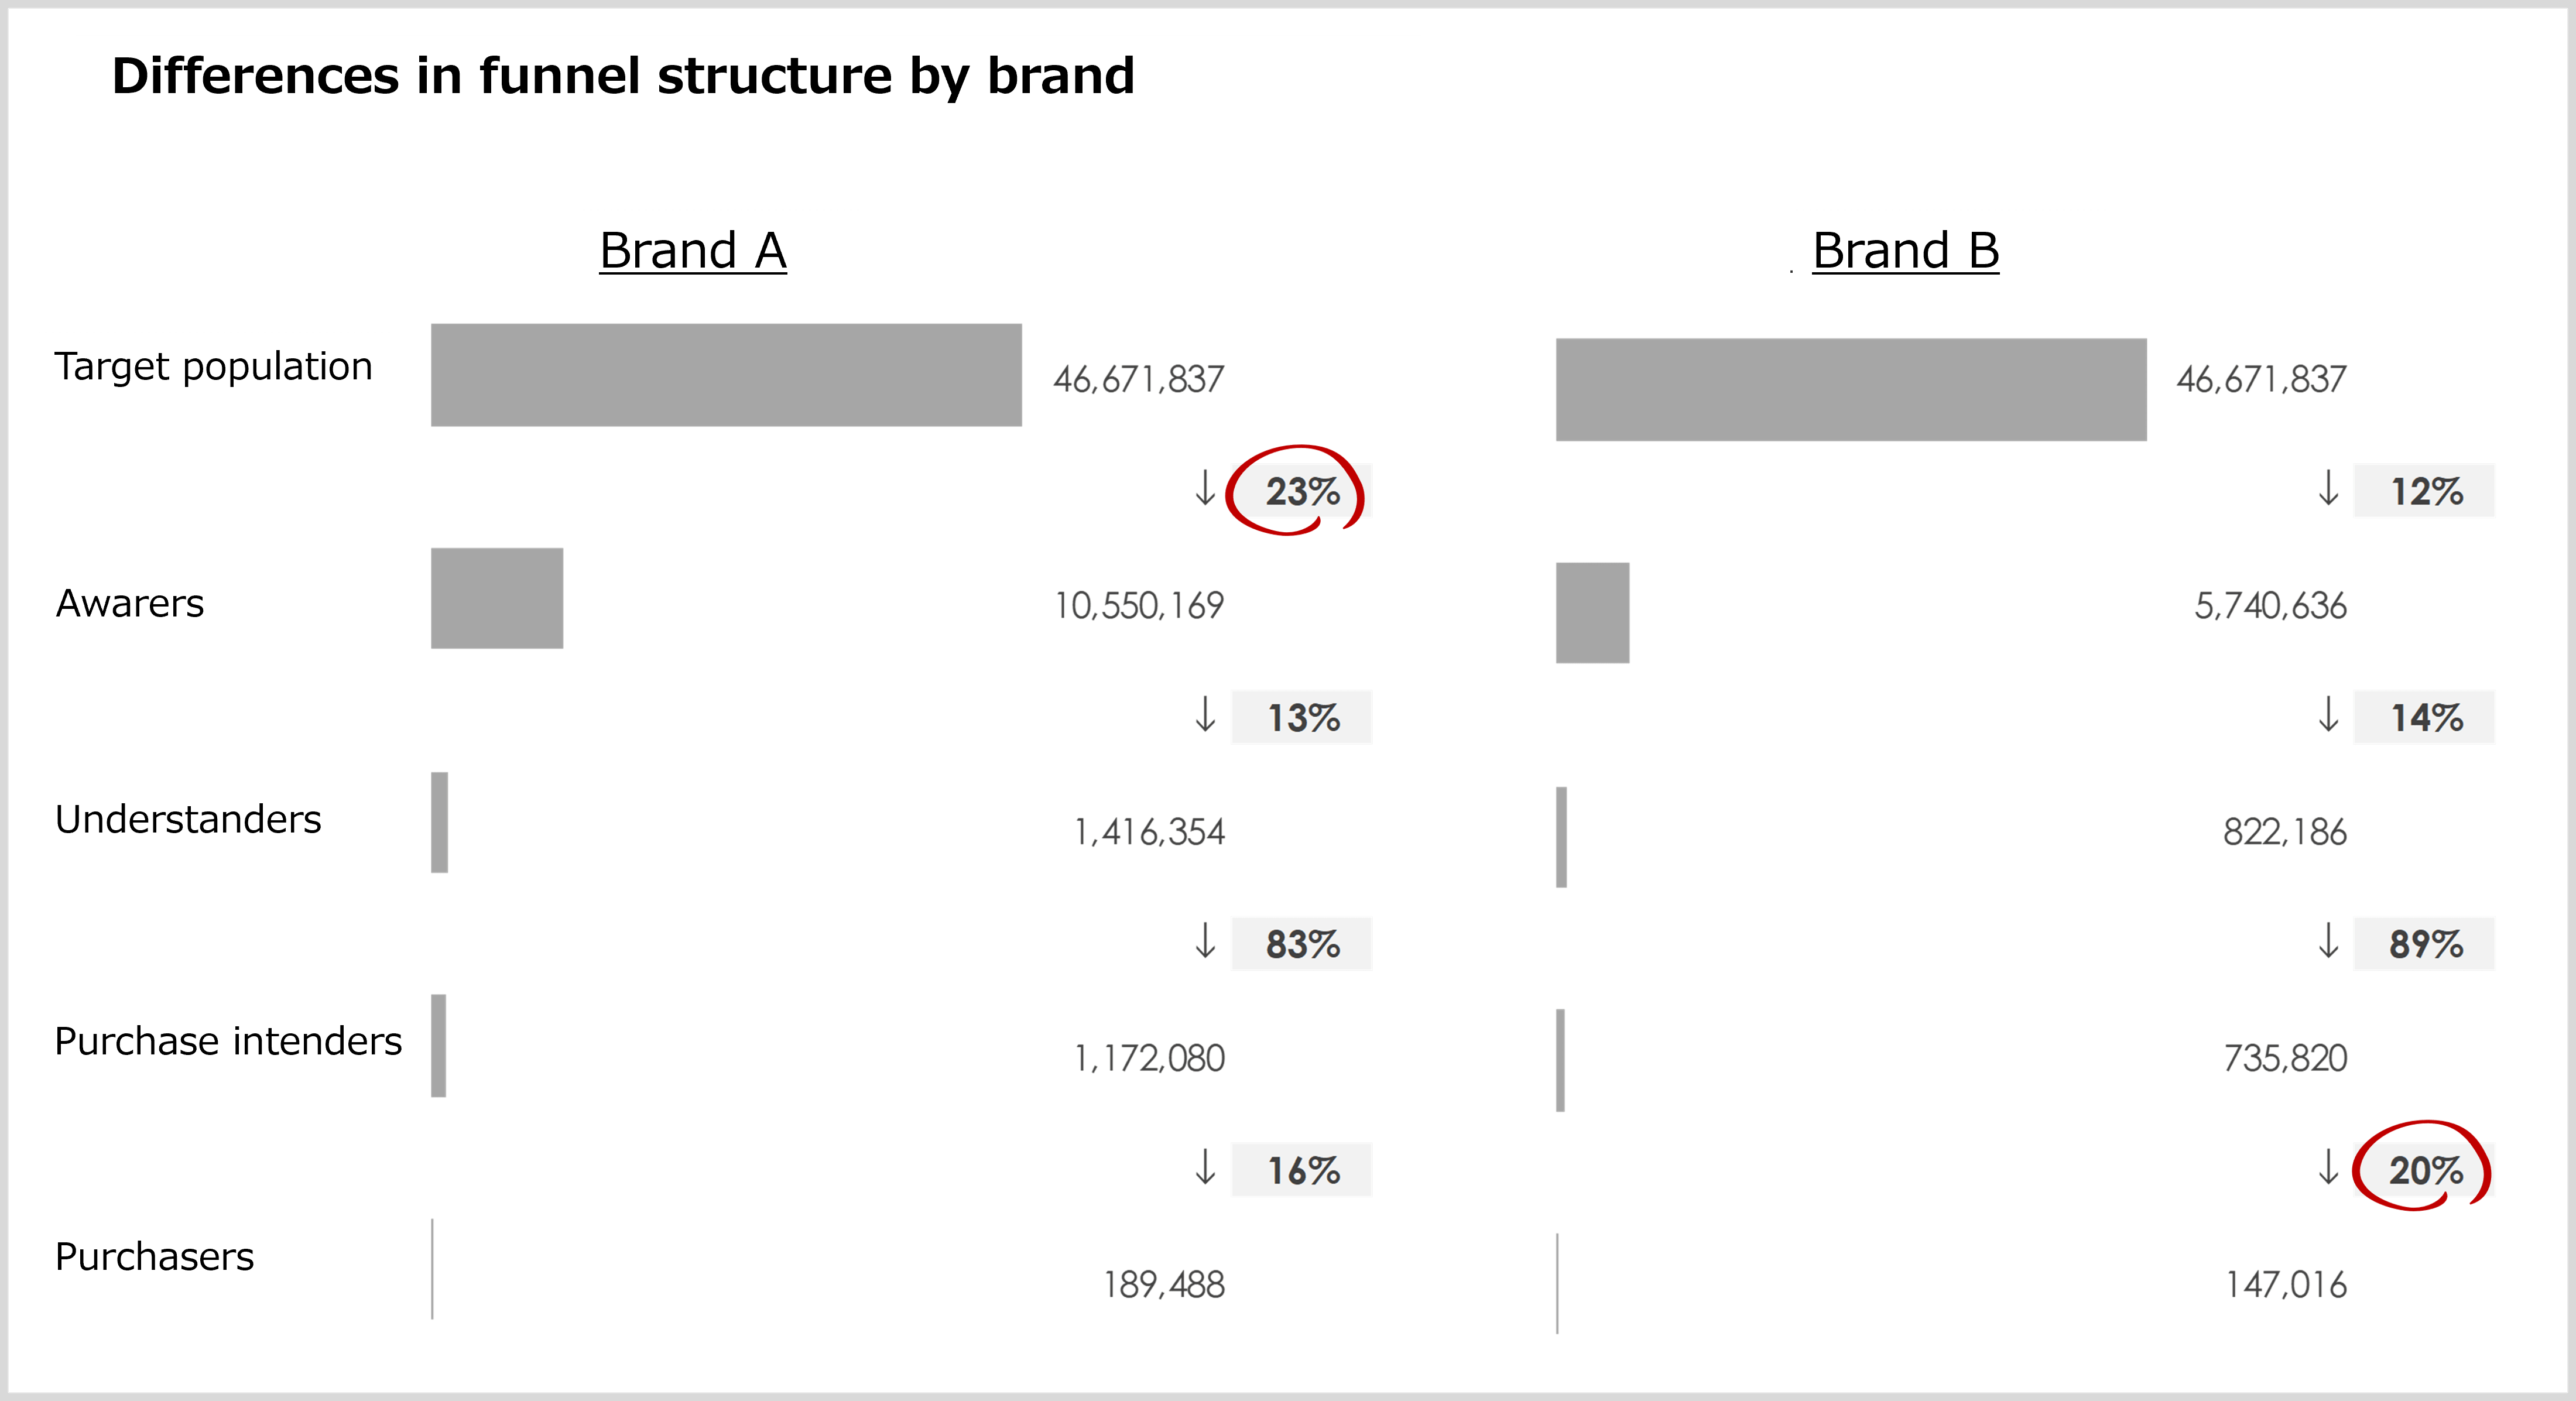
Fig. 1 shows the funnels of Brand A and Brand B, based on the findings of an independent survey conducted by INTAGE. Brand A is far superior to Brand B in terms of the number of people who are aware of, understand, and intend to purchase it, but because it has lower levels of conversion from Understanding to Purchase Intention and from Purchase Intention to Purchase, there is ultimately no major difference between the two brands in terms of number of purchasers.
Such differences can occur depending on whether we are focusing on the upper funnel (i.e., arousing Awareness and Understanding) or the lower funnel (Purchase Intention and Purchase). The above findings also show that the starting point for business growth may not necessarily be raising brand awareness.
Fig. 1
In addition, when exploring the starting point for business growth, it is important that the survey framework is designed so that the sales components can be broken down and issues can be identified. The following is a consumer behavior-based breakdown of sales value.
Sales value = Number of purchasers x Purchases per purchaser x Purchase value per purchase
When considering the next action, our starting point is the reasons for increase or decrease in each component of the breakdown. However, in current benchmark surveys, while reasons for increase/decrease in the number of purchasers are discussed, it is not easy to derive reliable values for “purchases per purchaser” and “purchase value per purchase” from surveys, especially in the consumer goods category, so these components are often not incorporated into the survey framework for discussion.
A Benchmark Survey Framework Tied to Business Performance
As noted above, the ideal benchmark survey is one that would take into account the entire funnel, up to and beyond purchase, allowing for comprehensive business analysis. Behaviors such as “purchases per purchaser” and “purchase value per purchase”, however, are difficult to capture correctly though questionnaire surveys.
As a way to address this issue, let us consider docking a consumer panel survey to a benchmark survey. Consumer panel surveys are databases that accumulate facts about who purchased what, when they purchased it, and for how much. By utilizing this data, purchase behavior data such as “number of purchasers”, “purchase value per purchaser”, and “purchase value per purchase” can be calculated more accurately and more easily than with a questionnaire survey. Such a survey framework would allow sales value to be explained in terms of consumer awareness and purchase behavior, so that the benchmark survey could be leveraged for setting business goals and tracking their progress.
Next, let us examine the validity of this research framework using data obtained by docking the INTAGE consumer panel SCI to our independently-conducted survey. *Docking was conducted using the “number of purchasers”, which can be obtained from both the benchmark survey and consumer panel, as the key metric, and by multiplying the funnel figures from the benchmark survey by INTAGE’s own correction factor.
Consumer Panel x Benchmark Survey Usage Example
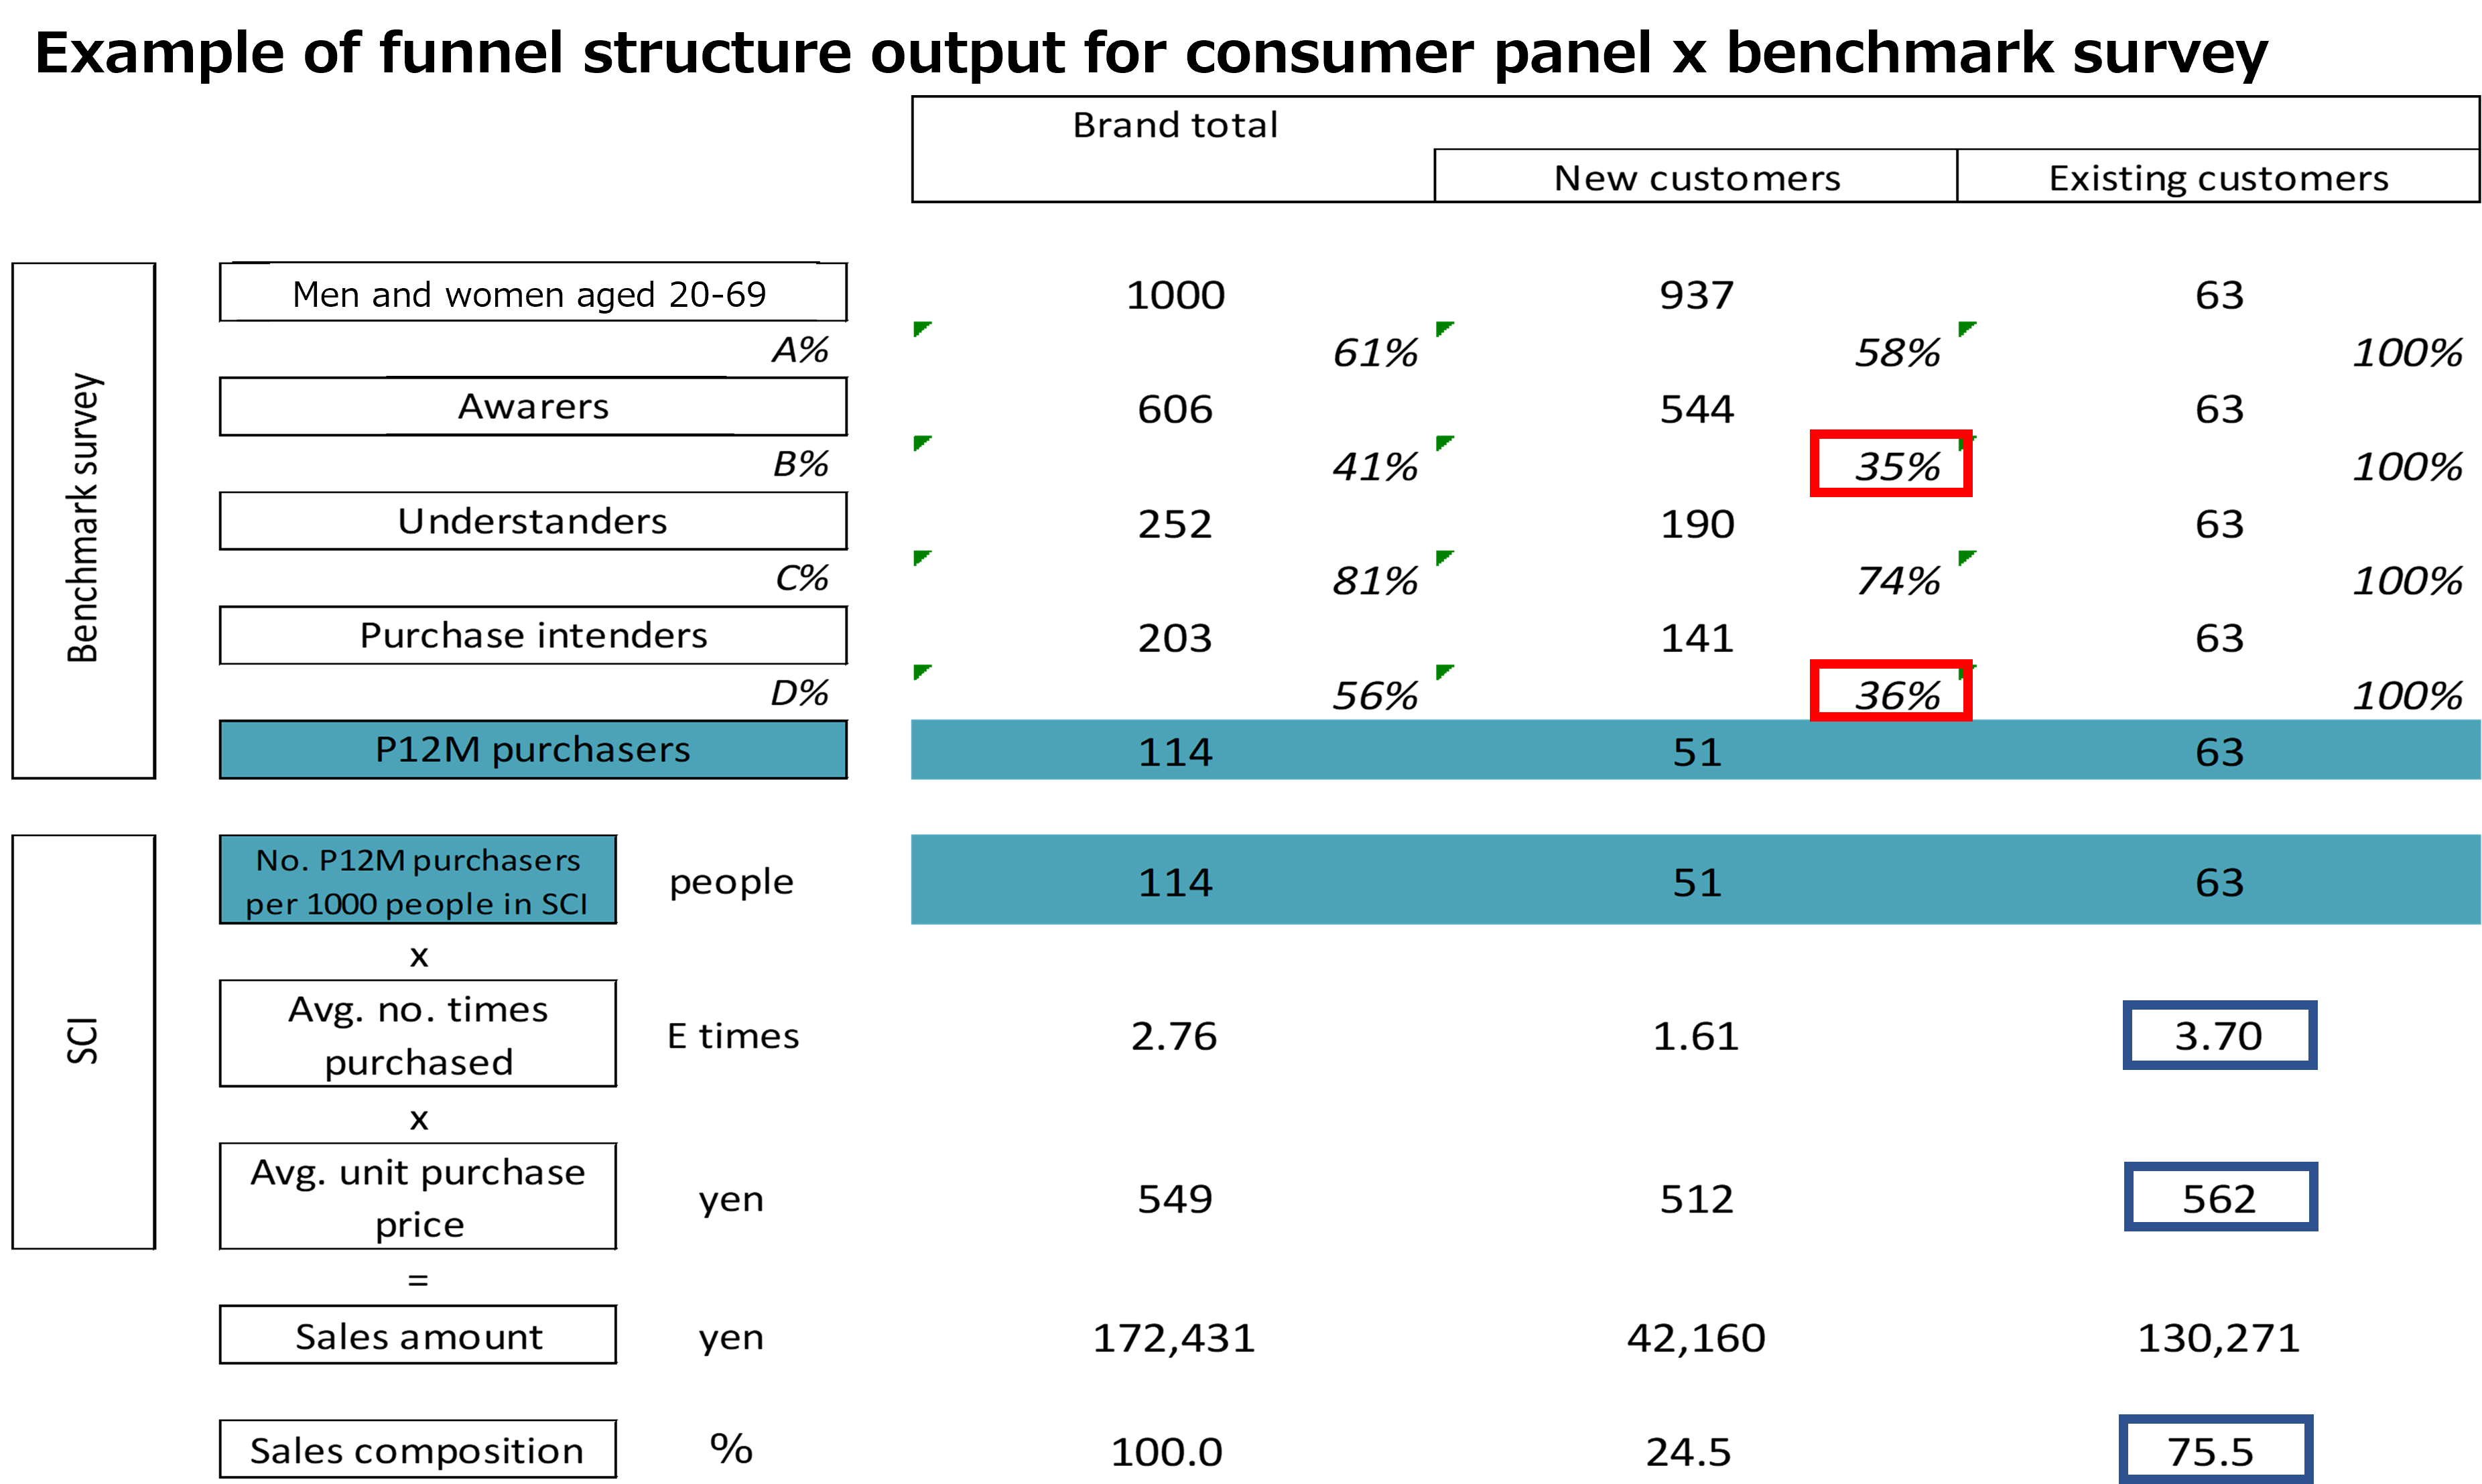
In Fig. 2, the key indicators for a certain brand are laid out. In this example, we have also divided “purchasers” into “new customers” and “existing customers”. The fact that approximately 75% of sales are generated by existing customers and only 25% by new customers suggests that acquiring new customers is one way to achieve business growth.
Fig. 2
These findings indicate that opportunities to acquire new purchasers lie in increasing the number of “understanders” (B%) and “purchasers” (D%). Until now, however, it has been difficult to use benchmark surveys to quantitatively show the impact of such improvements on sales value, making it difficult to determine if measures are necessary.
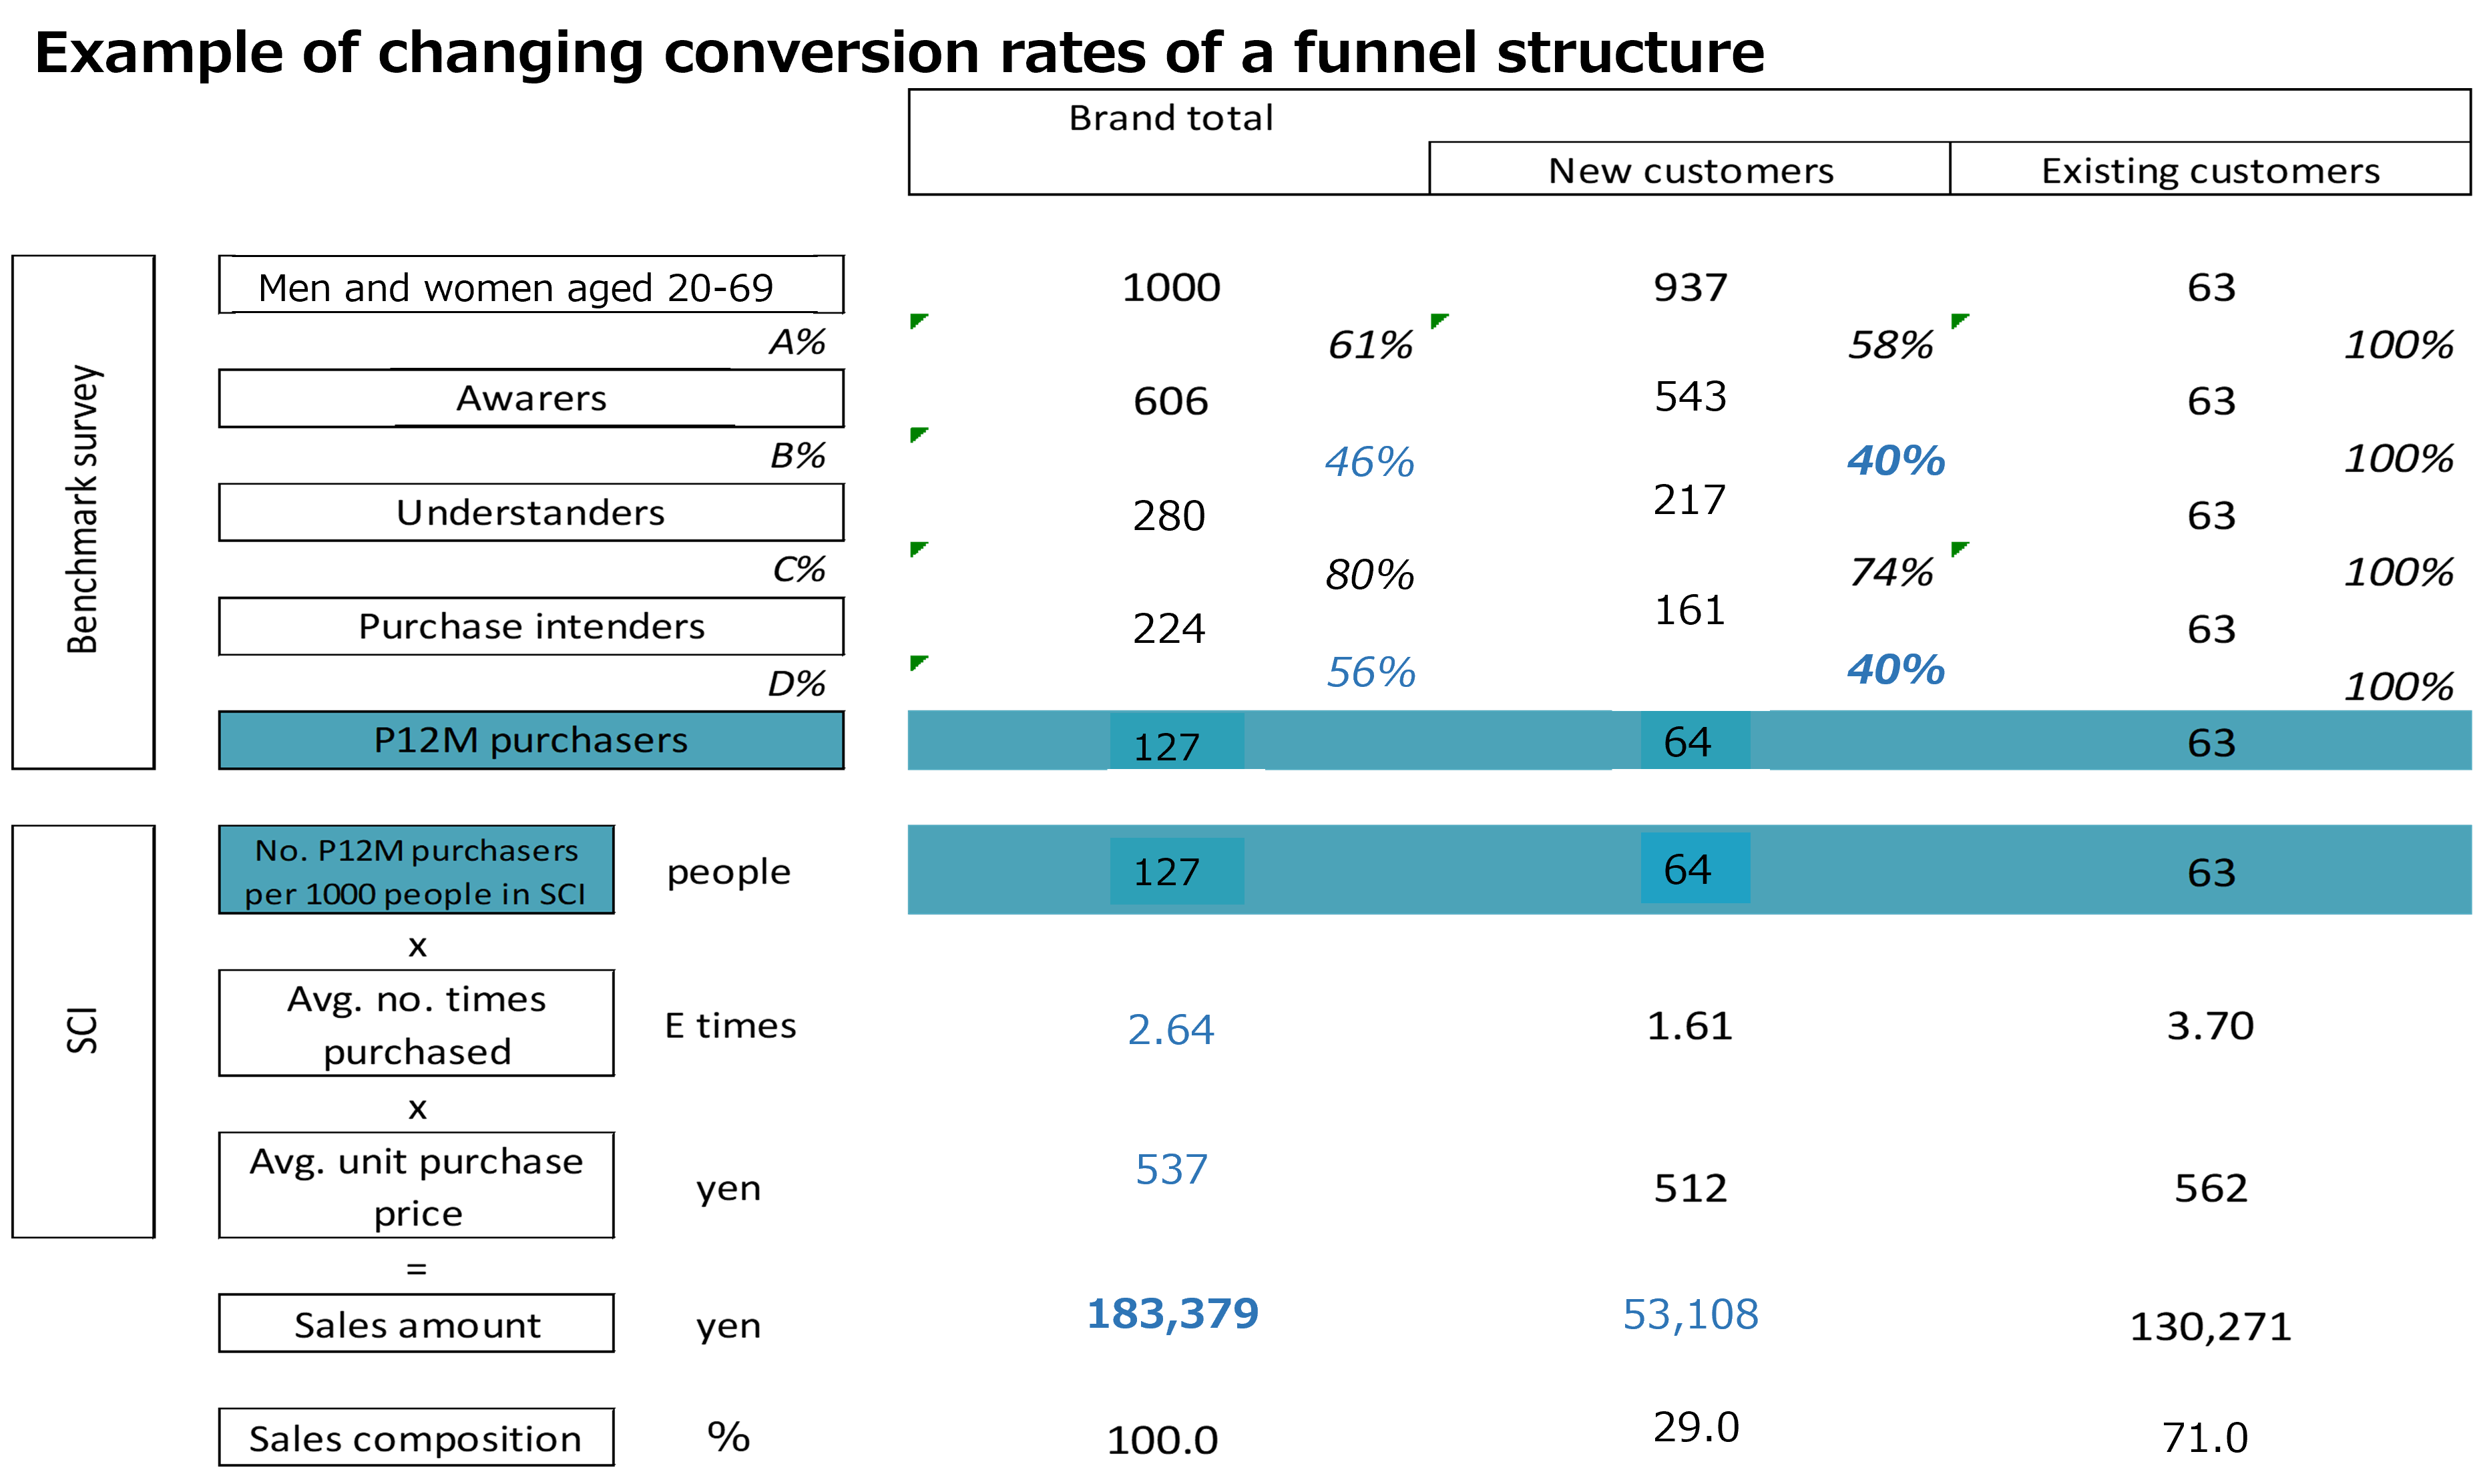
Fig. 3 shows projected changes in sales when B% and D% are improved in this survey framework. If B% and D% can both be raised to 40%, the sales value will change from 172,431 to 183,379, an estimated increase in sales value of about 6%.
Fig. 3
This sales figure is different from the actual market size, and the rate of increase is merely a guideline rather than a sales growth rate to which a real commitment can be made, but the ability to set targets with an approximate sense of what kind of increase can be expected is something that has been difficult to achieve with benchmark surveys up to now.
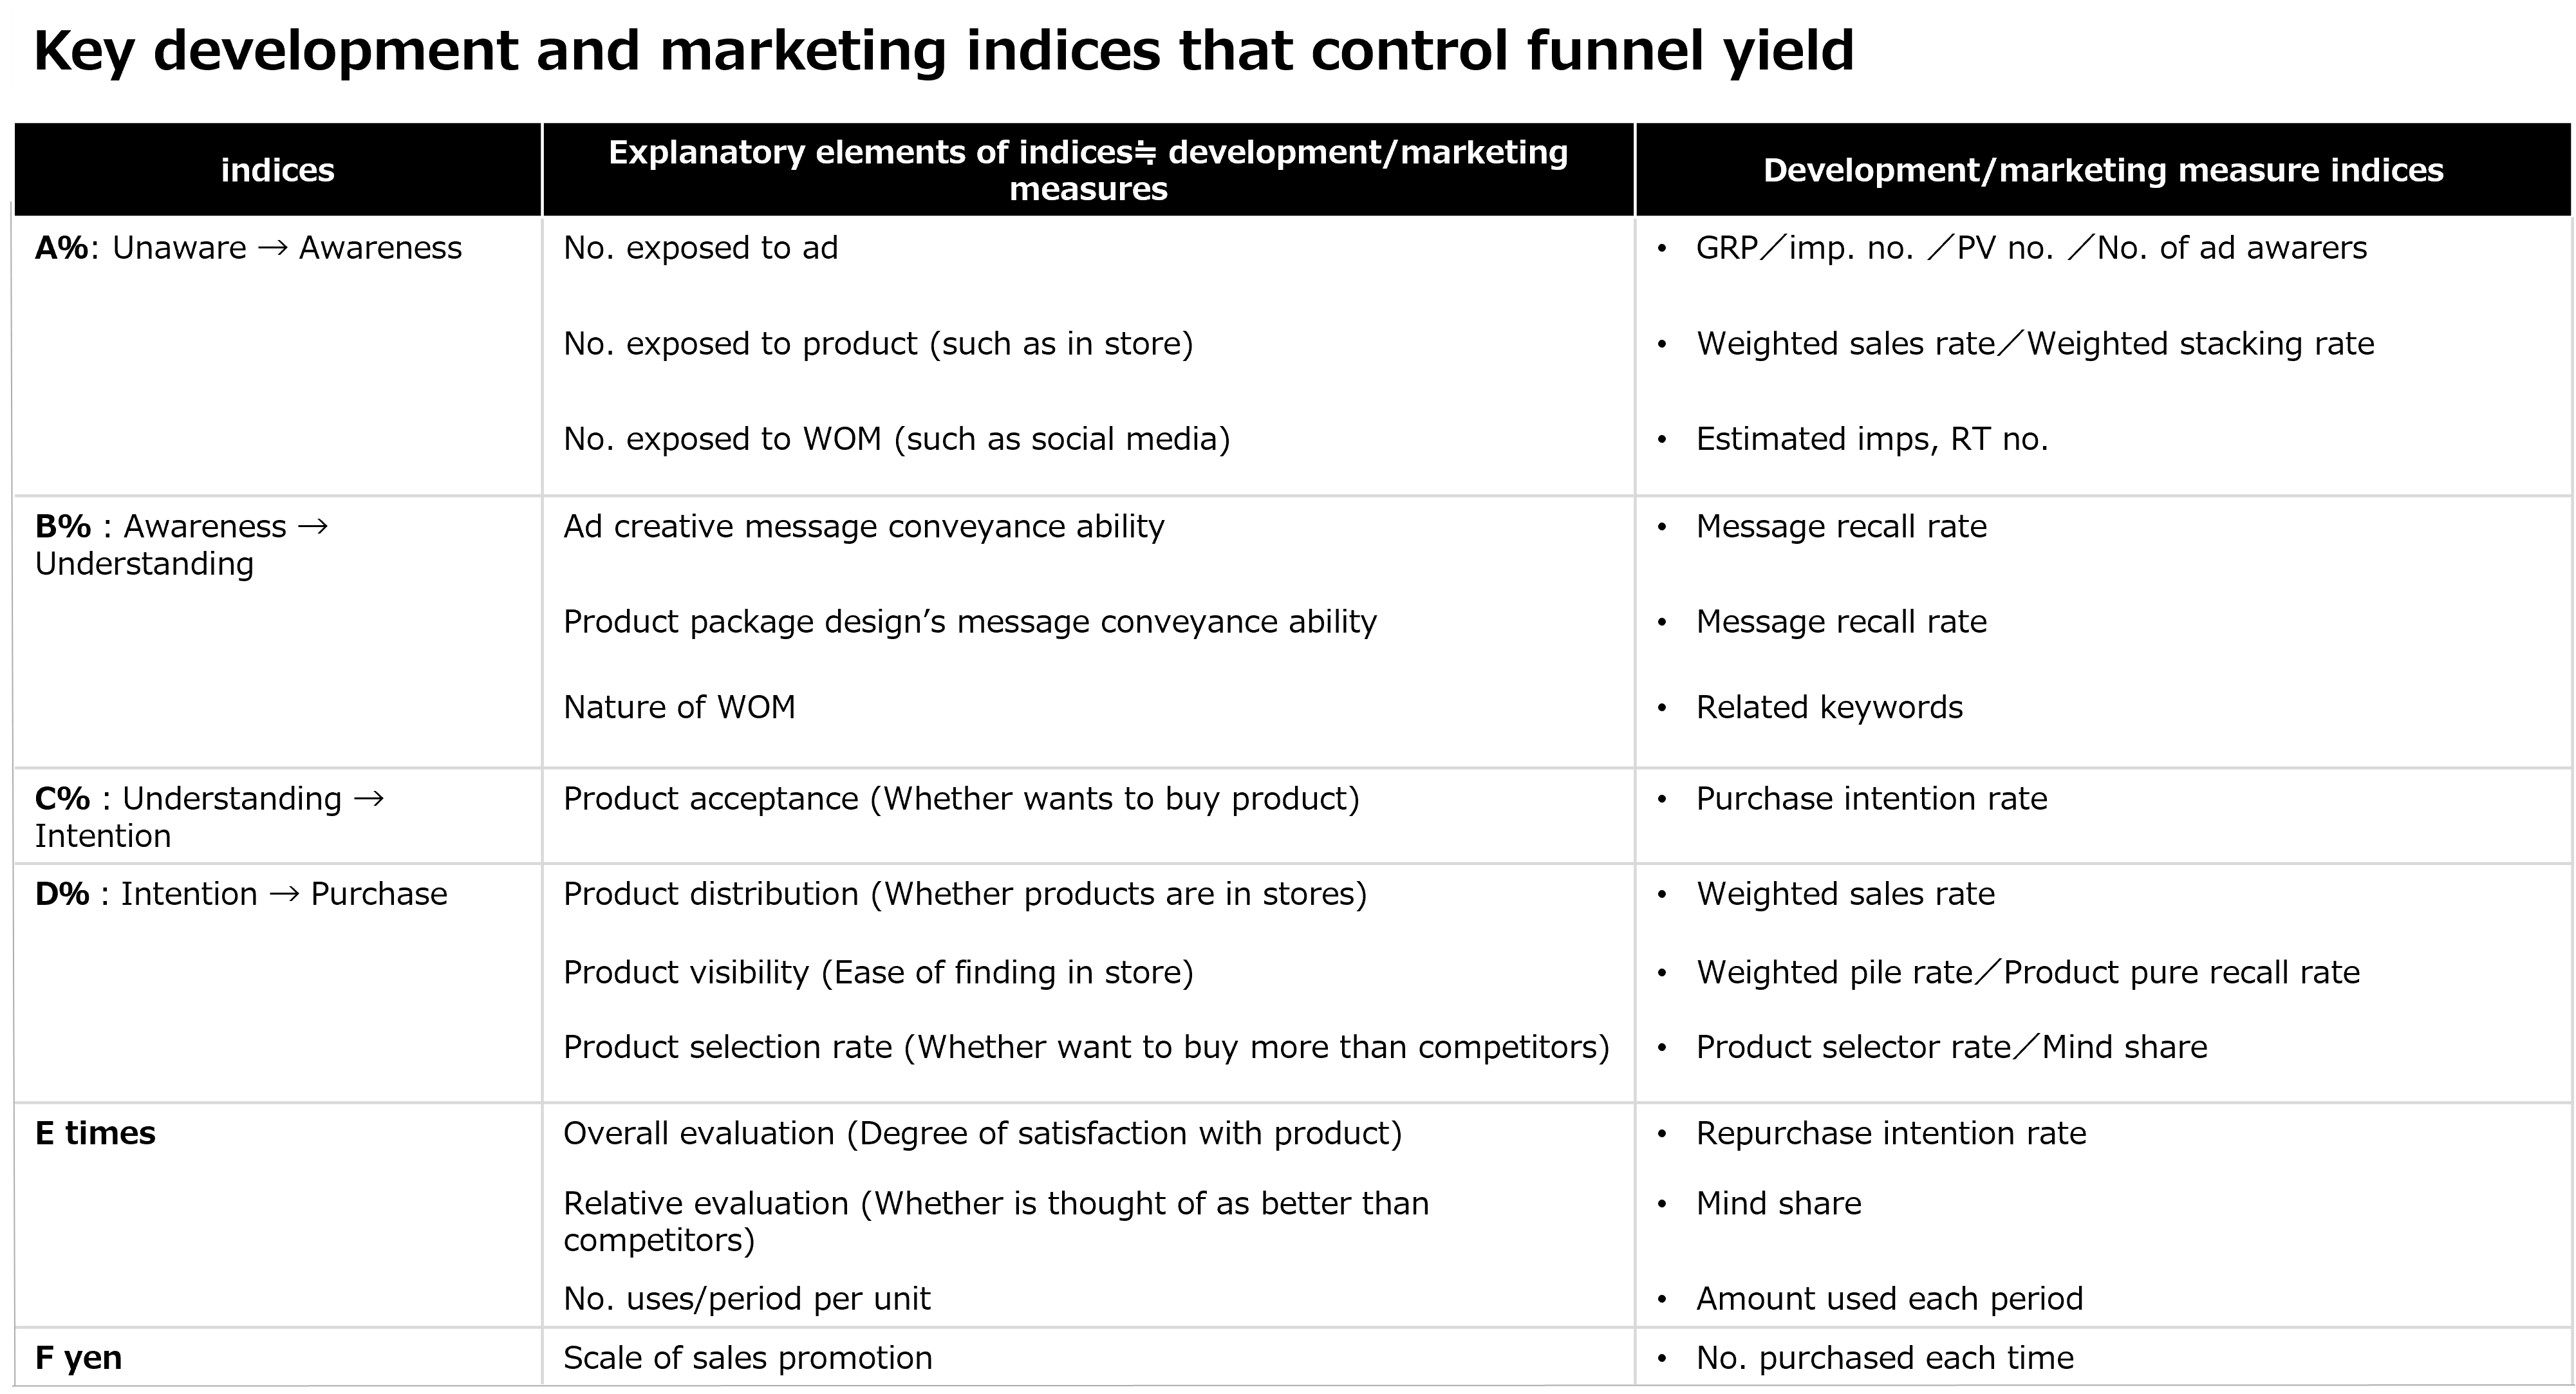
In actual operations, the feasibility of the B% and D% improvement targets (KPIs) will need to be reviewed, taking into account whether they are appropriate in light of the company’s capabilities and capacities, and whether they are targets that leverage the company’s strengths. Fig. 4 lists the key indicators that control conversion rates in the funnel. The structure of the real market is not quite as simple as this since there are many factors involved, but we think it will go a long way in helping you to understand the output of the benchmark survey framework we have presented here.
Fig. 4
Conclusion
In this article, we introduced the challenges of existing benchmarking surveys and a new framework for benchmark surveys that allows you to set business goals and check your progress.
Through this new benchmark survey framework, INTAGE hopes to contribute more than ever before to our customers’ businesses.
If you would like to utilize a consumer panel, have never conducted a benchmark survey but would like to do so, have conducted benchmark surveys but want to make them more useful to your business, or would like to develop a business plan that is more data-driven, please contact global-contact@intage.com.
Reproduction and Quotation
◆This report is copyrighted by INTAGE Inc. Please check the following prohibitions and precautions, and specify the source when reproducing or quoting this report. “Source: INTAGE “Knowledge Gallery” article published MM/DD/YYYY article”
◆The following are prohibited: ・Alteration of this article in full or in part ・Sale or publication of this article in full or in part ・Uses that are against public order and morality, and uses connected with illegal activities ・Reproducing or quoting panel data* for the purpose of advertising or promoting companies, products, or services *Panel data include: SRI+, SCI, SLI, Kitchen Diary, Car-kit, MAT-kit, Media Gauge, i-SSP, etc.
◆Other precautions: ・INTAGE Inc. shall not be liable for any trouble, loss, or damage caused by the use of this report ・These usage rules do not restrict the use of quotations or other uses permitted under the Copyright Act of Japan
◆For inquiries about reproduction and quotation, click here.