Corroborating Changes from Cohort Analysis of 156 Food + Beverage + Alcohol Categories
Intage previously conducted a cohort analysis using data from SCI *1 (the consumer panel), which we analyzed to ascertain projected future market size in Japan.
The following is a brief summary of the three main points of that analysis. 1. The food + beverage + alcohol market will shrink much faster than Japan’s rate of population decline 2. The impact of Japan’s declining birthrate and aging population varies by category 3. New awareness can be gained by interpreting the effects of “generation,” “aging,” and “time period” alongside other events and background information
In order to become aware of what will happen in the future, it is important to understand the evidence of the changes that have taken place thus far.
Therefore, in this article, from among 156 food + beverage + alcohol categories, we will focus on changes in the following highly substitutable categories: • Sweets (chewing gum, candy, candy tablets, gummy candy) • Milk drinks (fermented milk drinks, yogurt drinks, lactic acid drinks, soy milk) • Types of beer (beer, low-malt beer, new product types) In so doing, we will try to understand the factors that have changed thus far based on the effects of “generation” and “time period.”
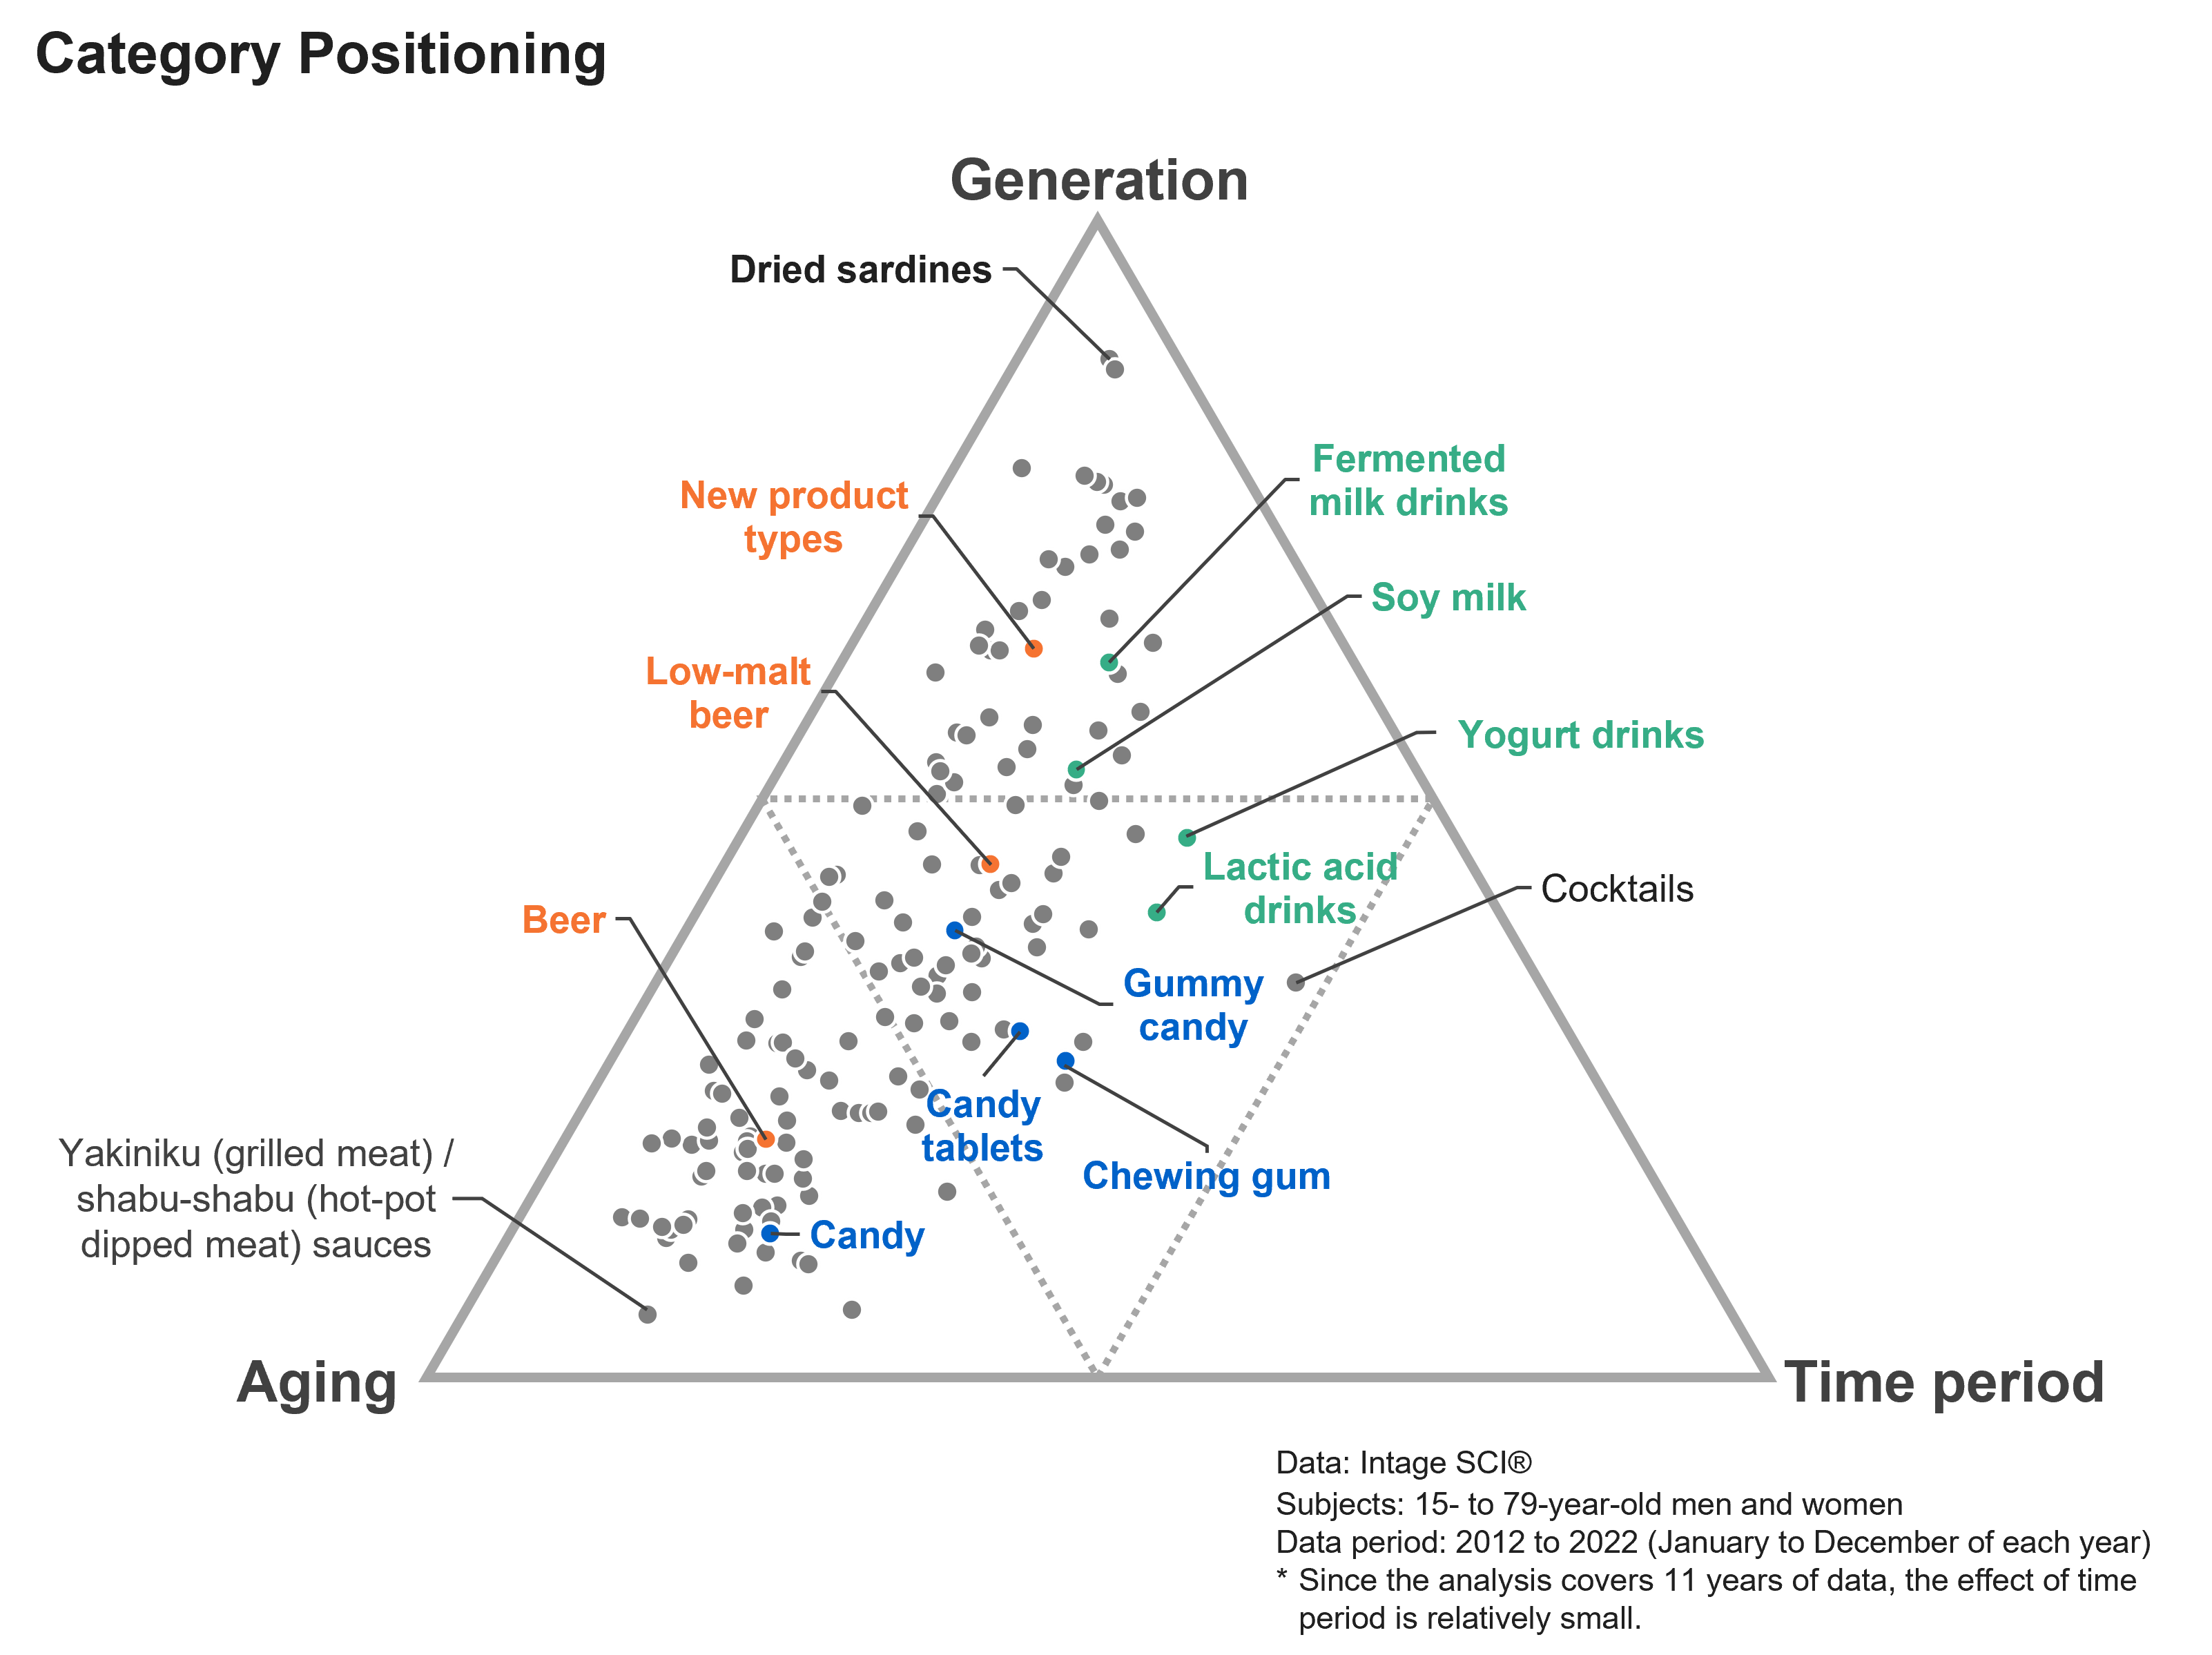
First we will take a bird’s-eye view of the positioning of the 156 food + beverage + alcohol categories. Fig.1 is a triangular graph showing the relative magnitude of the three effects (generation, aging, and time period) on each category. To put it simply, the closer each category is to a given vertex, the greater that effect has on that category compared to the other effects. For example, we can see that “dried sardines” is a category for which the effect of generation is much larger than that of aging or time period.
Fig.1
Fig.1 reveals that many categories are concentrated in the lower left zone of the triangle, where the effect of aging is larger than the other effects. This means that many categories are affected by the changes that occur as we age (life stages, eating and drinking preferences, body shape and constitution, etc.).
When comparing the categories discussed in this article, there are also differences in positioning, such as that generation has a large effect on new product types and fermented milk drinks, whereas time period has a large effect on chewing gum, lactic acid drinks, and yogurt drinks. We will now analyze in detail what factors produce this difference.
Definitions of Each Generation
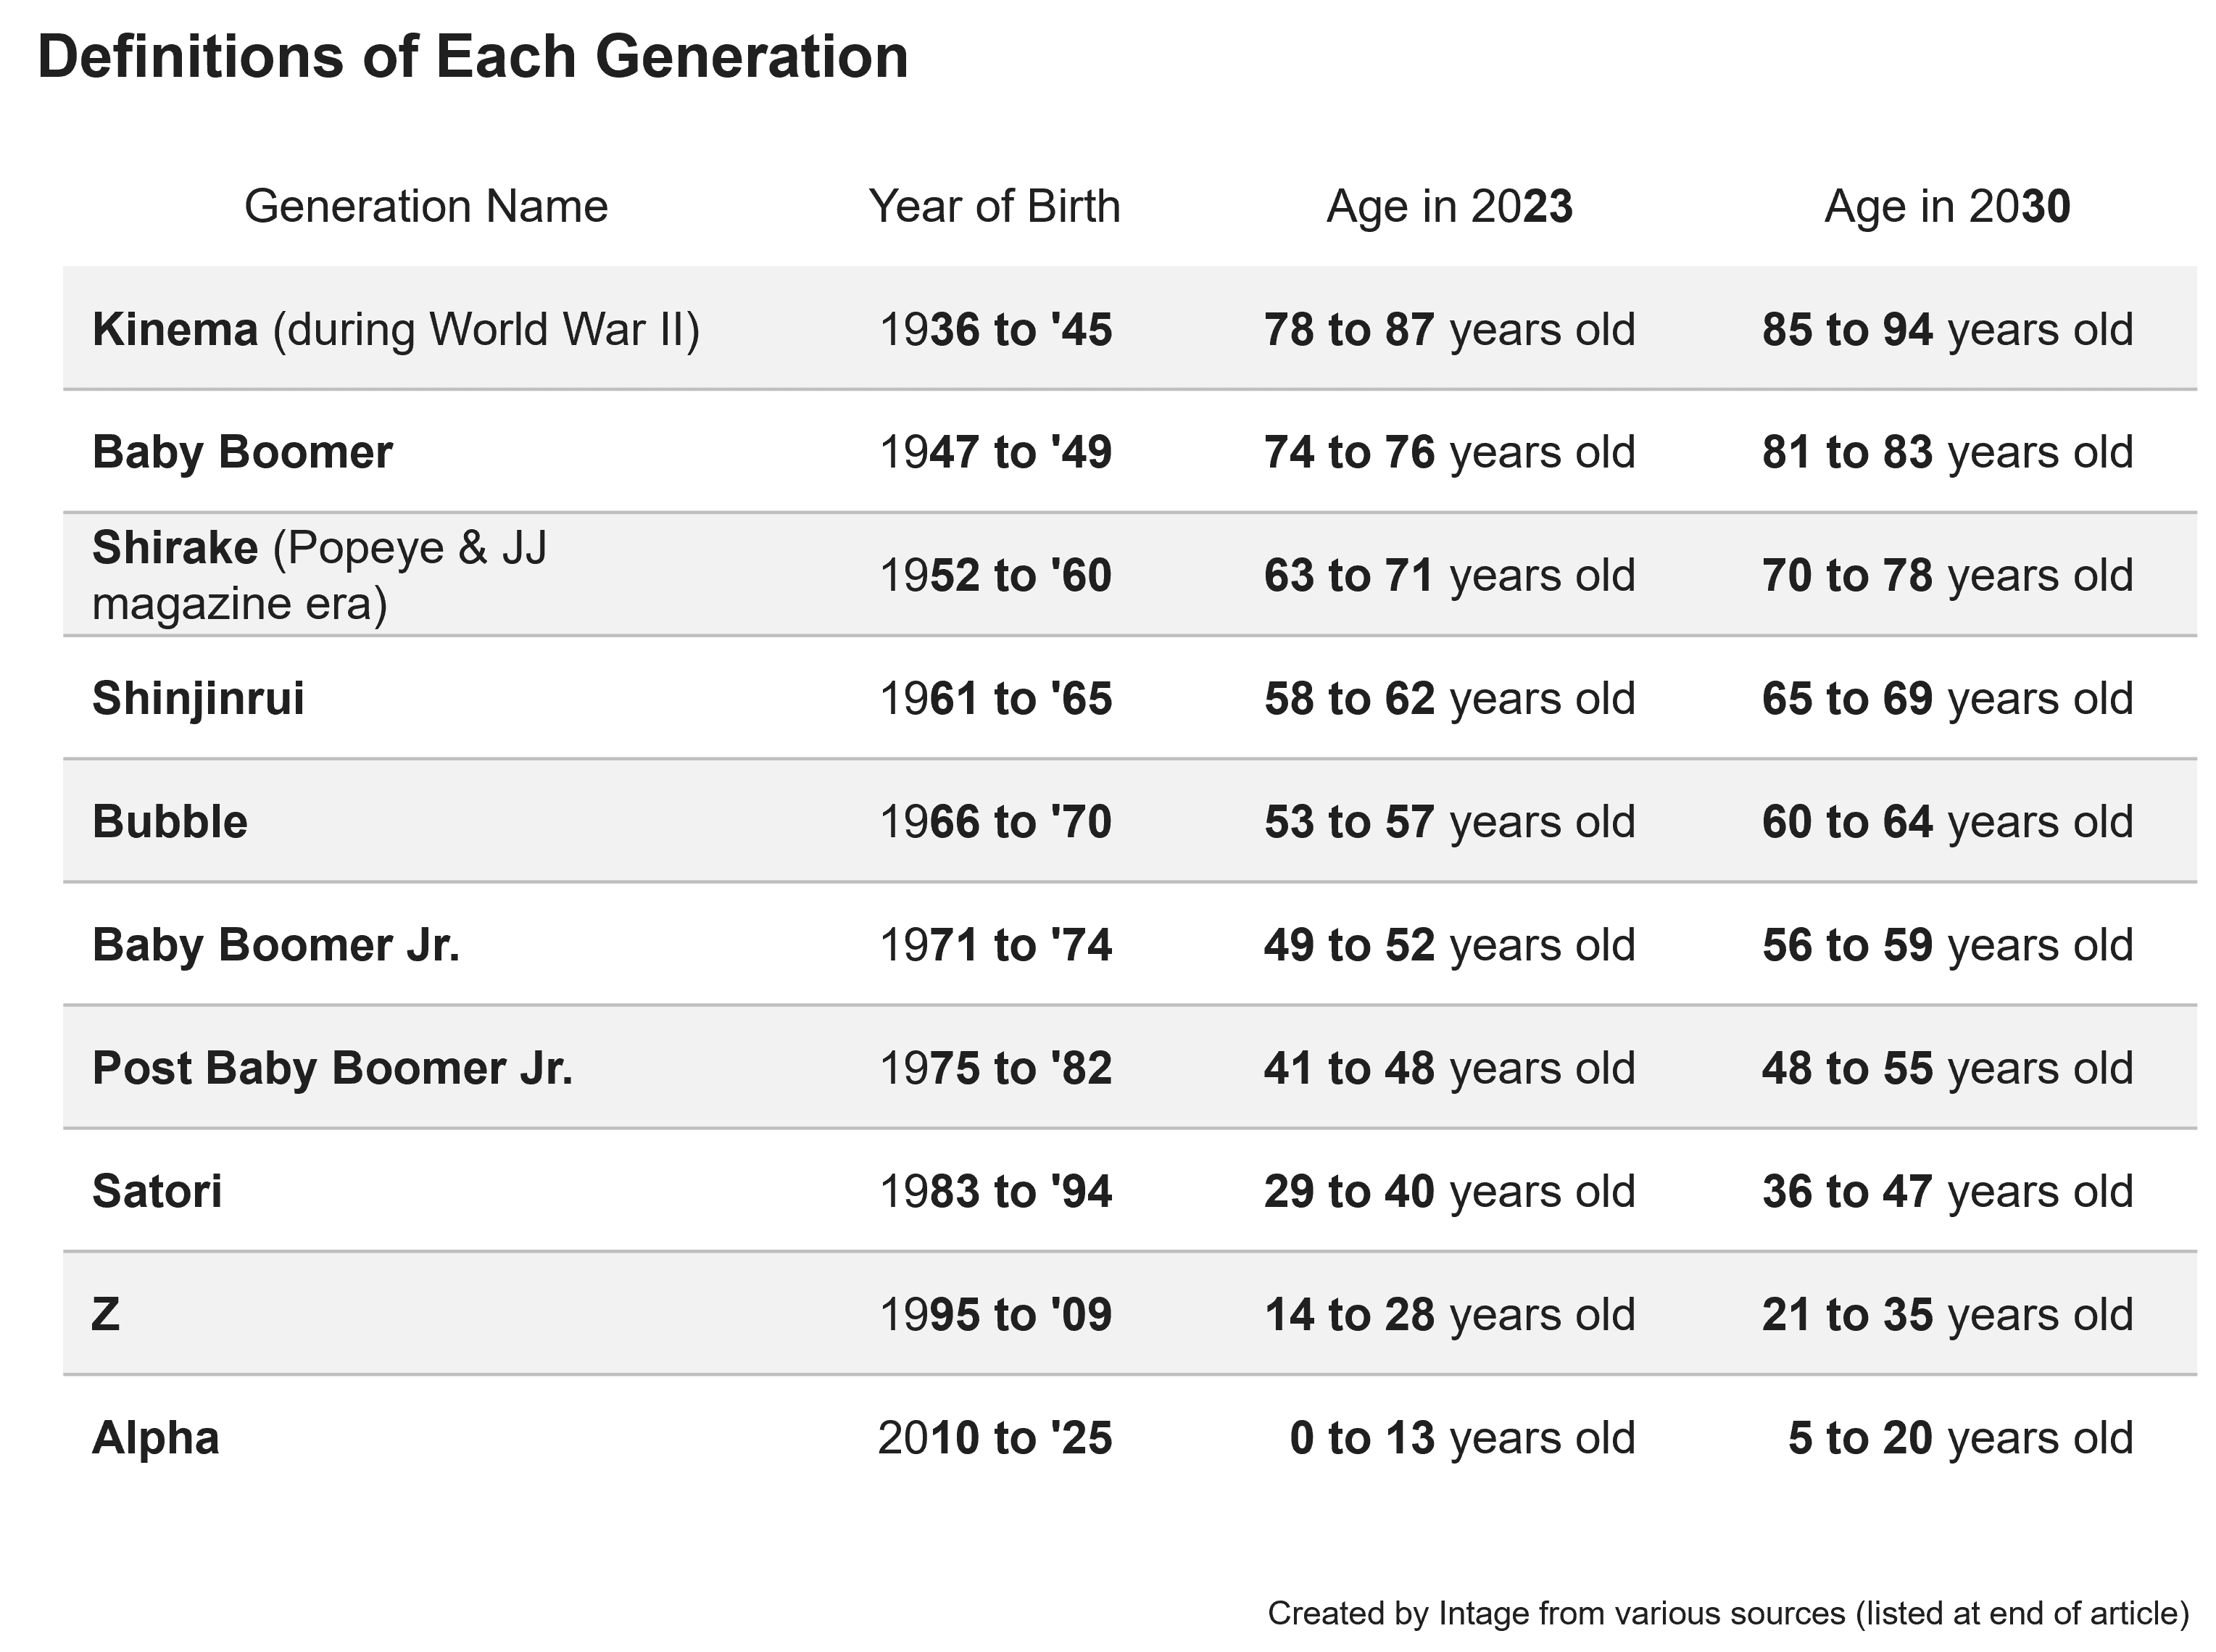
Let’s take a moment to pin down the definitions of each generation, which will be required when interpreting the results of the cohort analysis. There are various definitions in use, but our commentary in this analysis will be based on the definitions in Fig.2.
Fig.2
Now, let’s look specifically at each of the three cases chosen as the main theme for this article.
The Case of Sweets
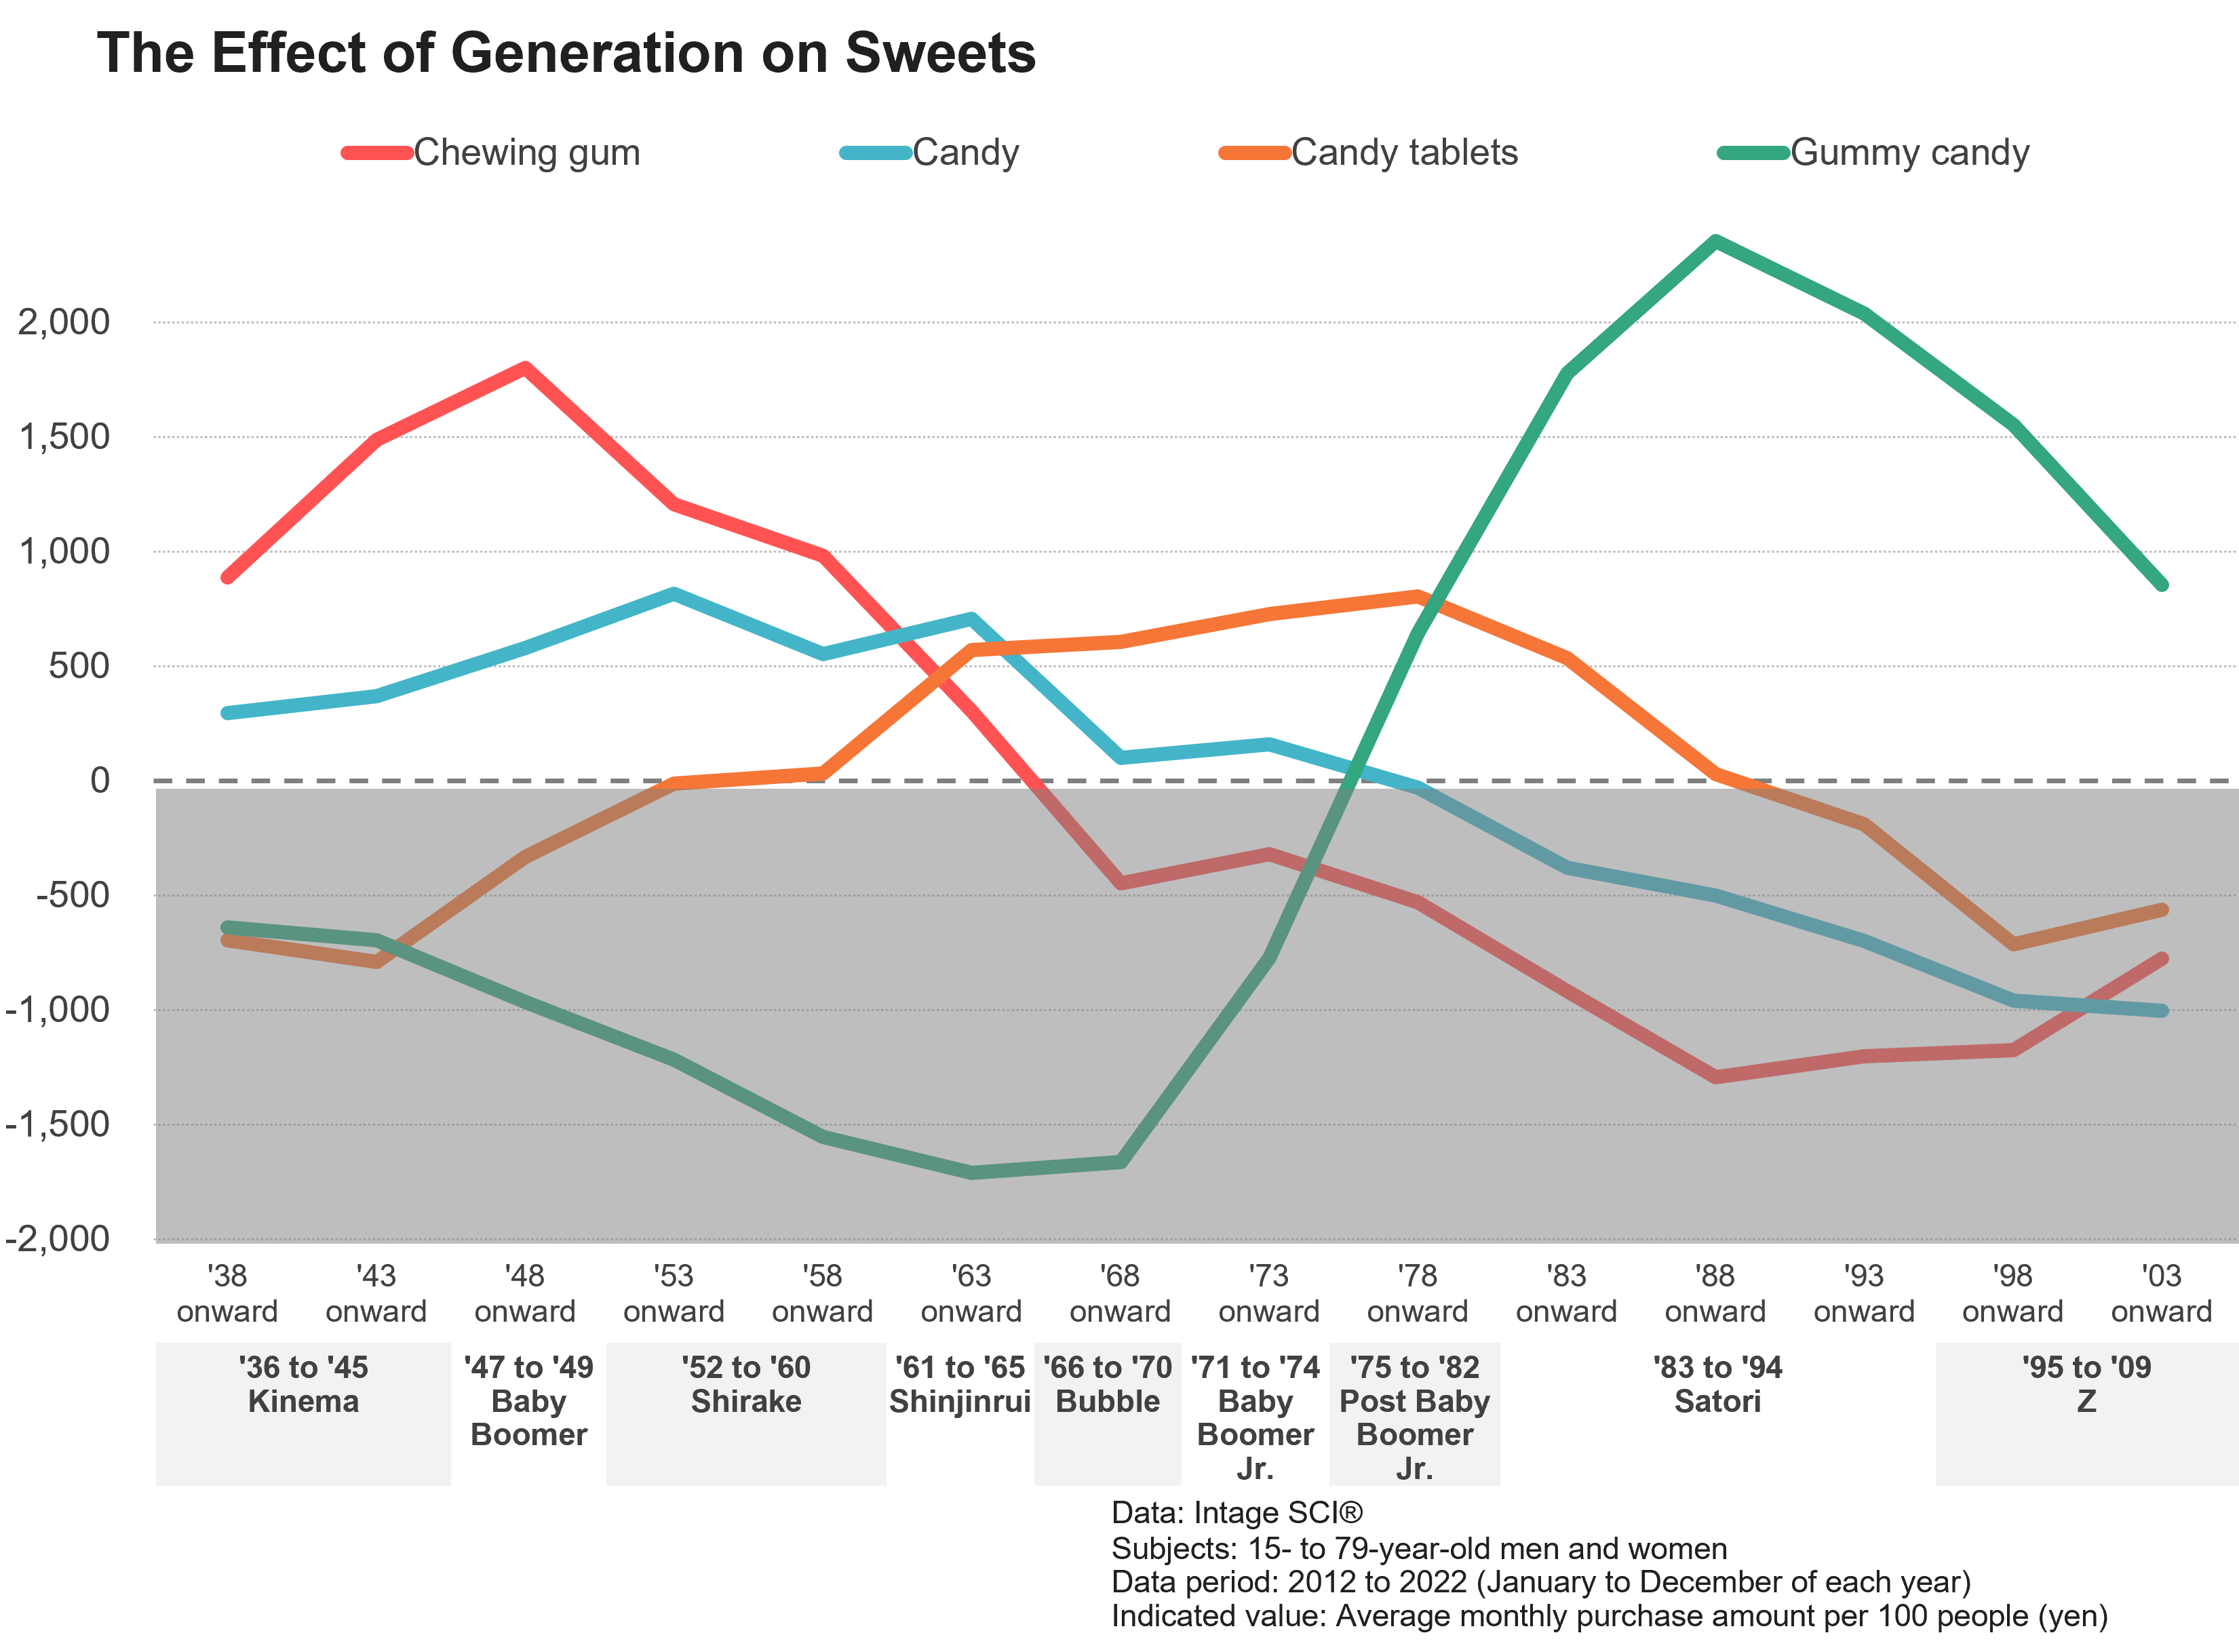
Fig.3 shows the effect of generation on the four categories of chewing gum, candy, candy tablets, and gummy candy. If the number associated with the generation is positive, the amount of money spent on purchasing items in the category is higher than the average, and if it is negative, the purchase amount is lower than the average. For example, we can see that “chewing gum” is a category that is bought more by Baby Boomers born from 1947 to 1949.
Fig.3
Consumers may put the following four categories of sweets in their mouths to relive the desire for something to nibble on, to refresh themselves, or to relax, but each has a different generation supporting demand for it. • “Chewing gum” is supported by Baby Boomers, as mentioned above • “Candy” is supported by the Shirake generation born from 1952 to 1960 and the Shinjinrui generation born from 1961 to 1965 • “Candy tablets” is supported by the Bubble generation born from 1966 to 1970, the Baby Boomer Jr. generation born from 1971 to 1974, and the Post Baby Boomer Jr. generation born from 1975 to 1982 • “Gummy candy” is supported by the Satori generation born from 1983 to 1995 These generations purchase more of each sweets category listed above than other generations.
These are the results of the time when each category was newly launched and widely spread. They are also influenced by the age of each generation at that time.
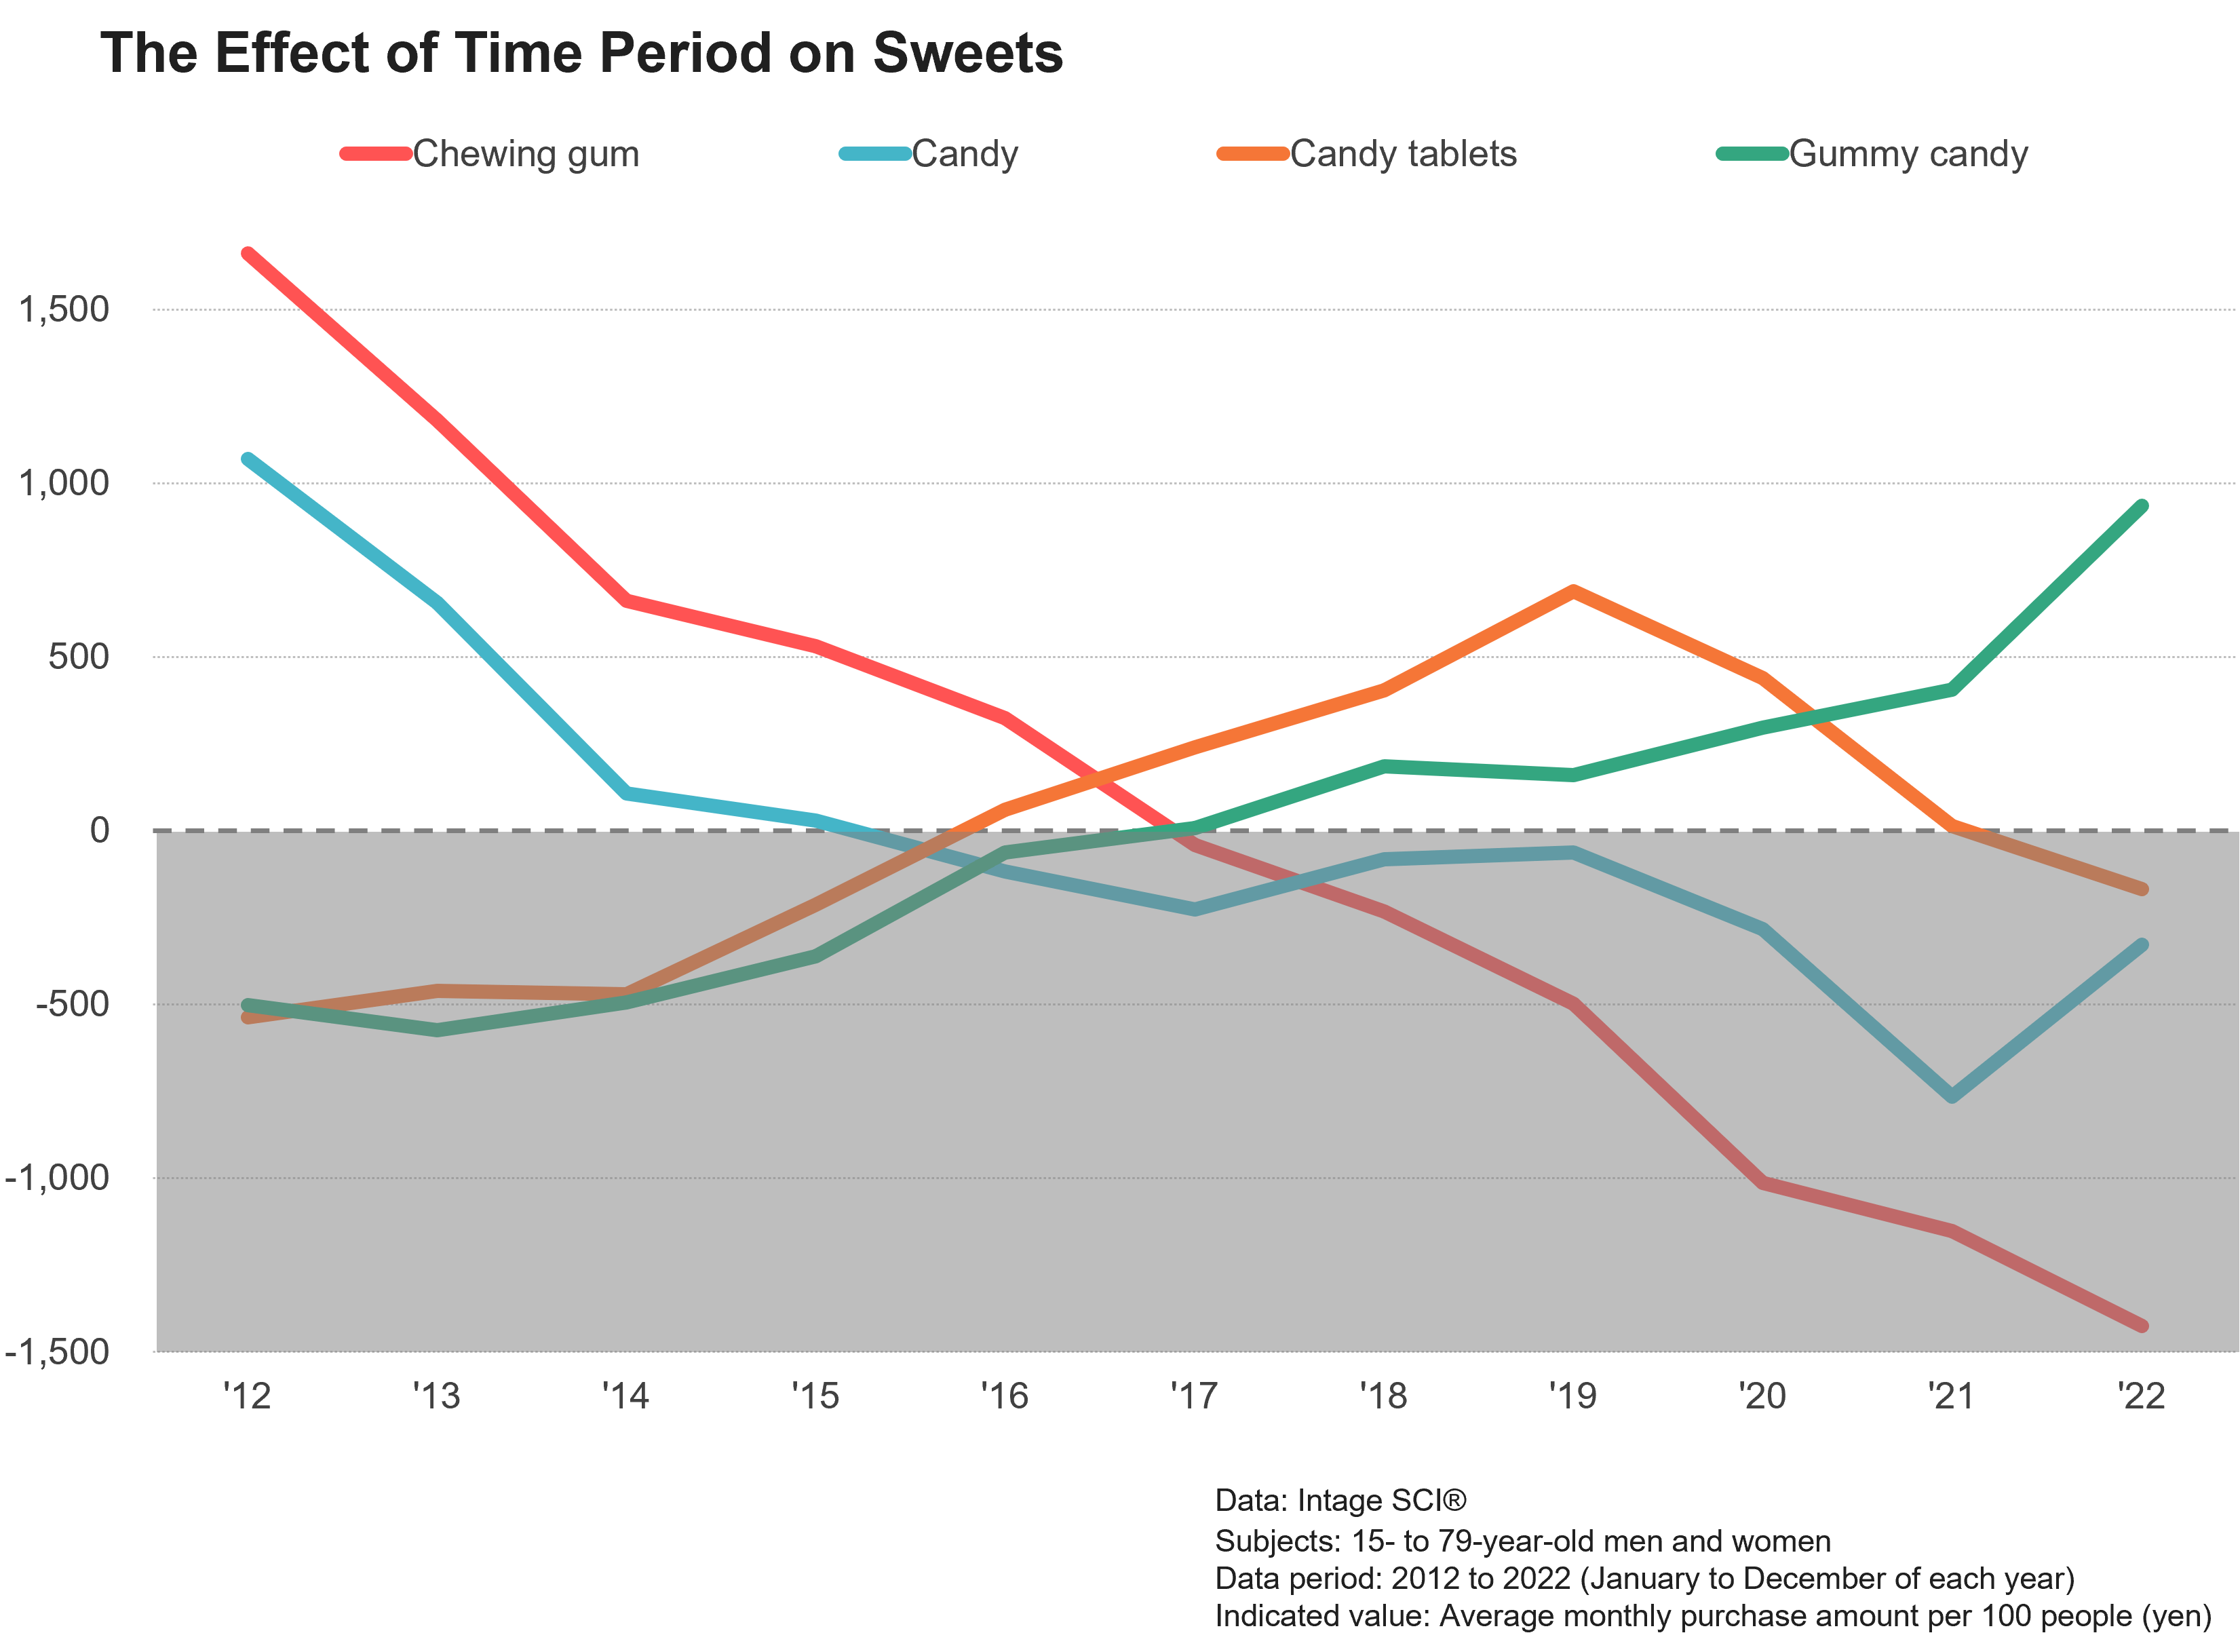
Fig.4 shows the effect of time period on these four categories of sweets. The interpretation is similar to that of the effect of generation.
Fig.4
• “Chewing gum” fell continuously for a long time from 2012 to 202 • “Candy” turned negative in 2016 and has since been flat to declining • “Candy tablets” turned positive in 2016, increased thereafter, peaked in 2019 due to the Covid-19 pandemic, and have been declining since then • “Gummy candy” continued to increase since 2013 and surged in 2022 due to hit products These are the results of changes in lifestyles and values, disasters, booms, and hit products.
The results so far, looking at generation and time period together, show that chewing gum is doing poorly and gummy candy is doing well.
As a reason why chewing gum is doing poorly, the Covid-19 pandemic has increased long-term awareness of cleanliness and hygiene, including actions like deodorizing body odor and bad breath, as well as sanitizing straps and toilet seats, and this has resulted in people avoiding the acts of spitting out things they put in their mouths and carrying chewed garbage.
As a reason why gummy candy is doing well, we can point to how it has many benefits, such as not only taste and flavor but also textures, shapes, and colors that make it more broadly enjoyable to eat, added ingredients that are good for beauty and health, and how it can satisfy slight hunger pangs with less guilt. In addition, behaviors seeking “healing, warmth, and connection” increased due to the Covid-19 pandemic, and hit products have become a hot topic on social media, especially among Generation Z.
The withdrawal of a major food manufacturer from the gum business in March 2023 and its conversion of its long-selling brand to gummy candy in April are also understandable given their competitive position and market share in gum and gummy candy.
The Case of Milk Drinks
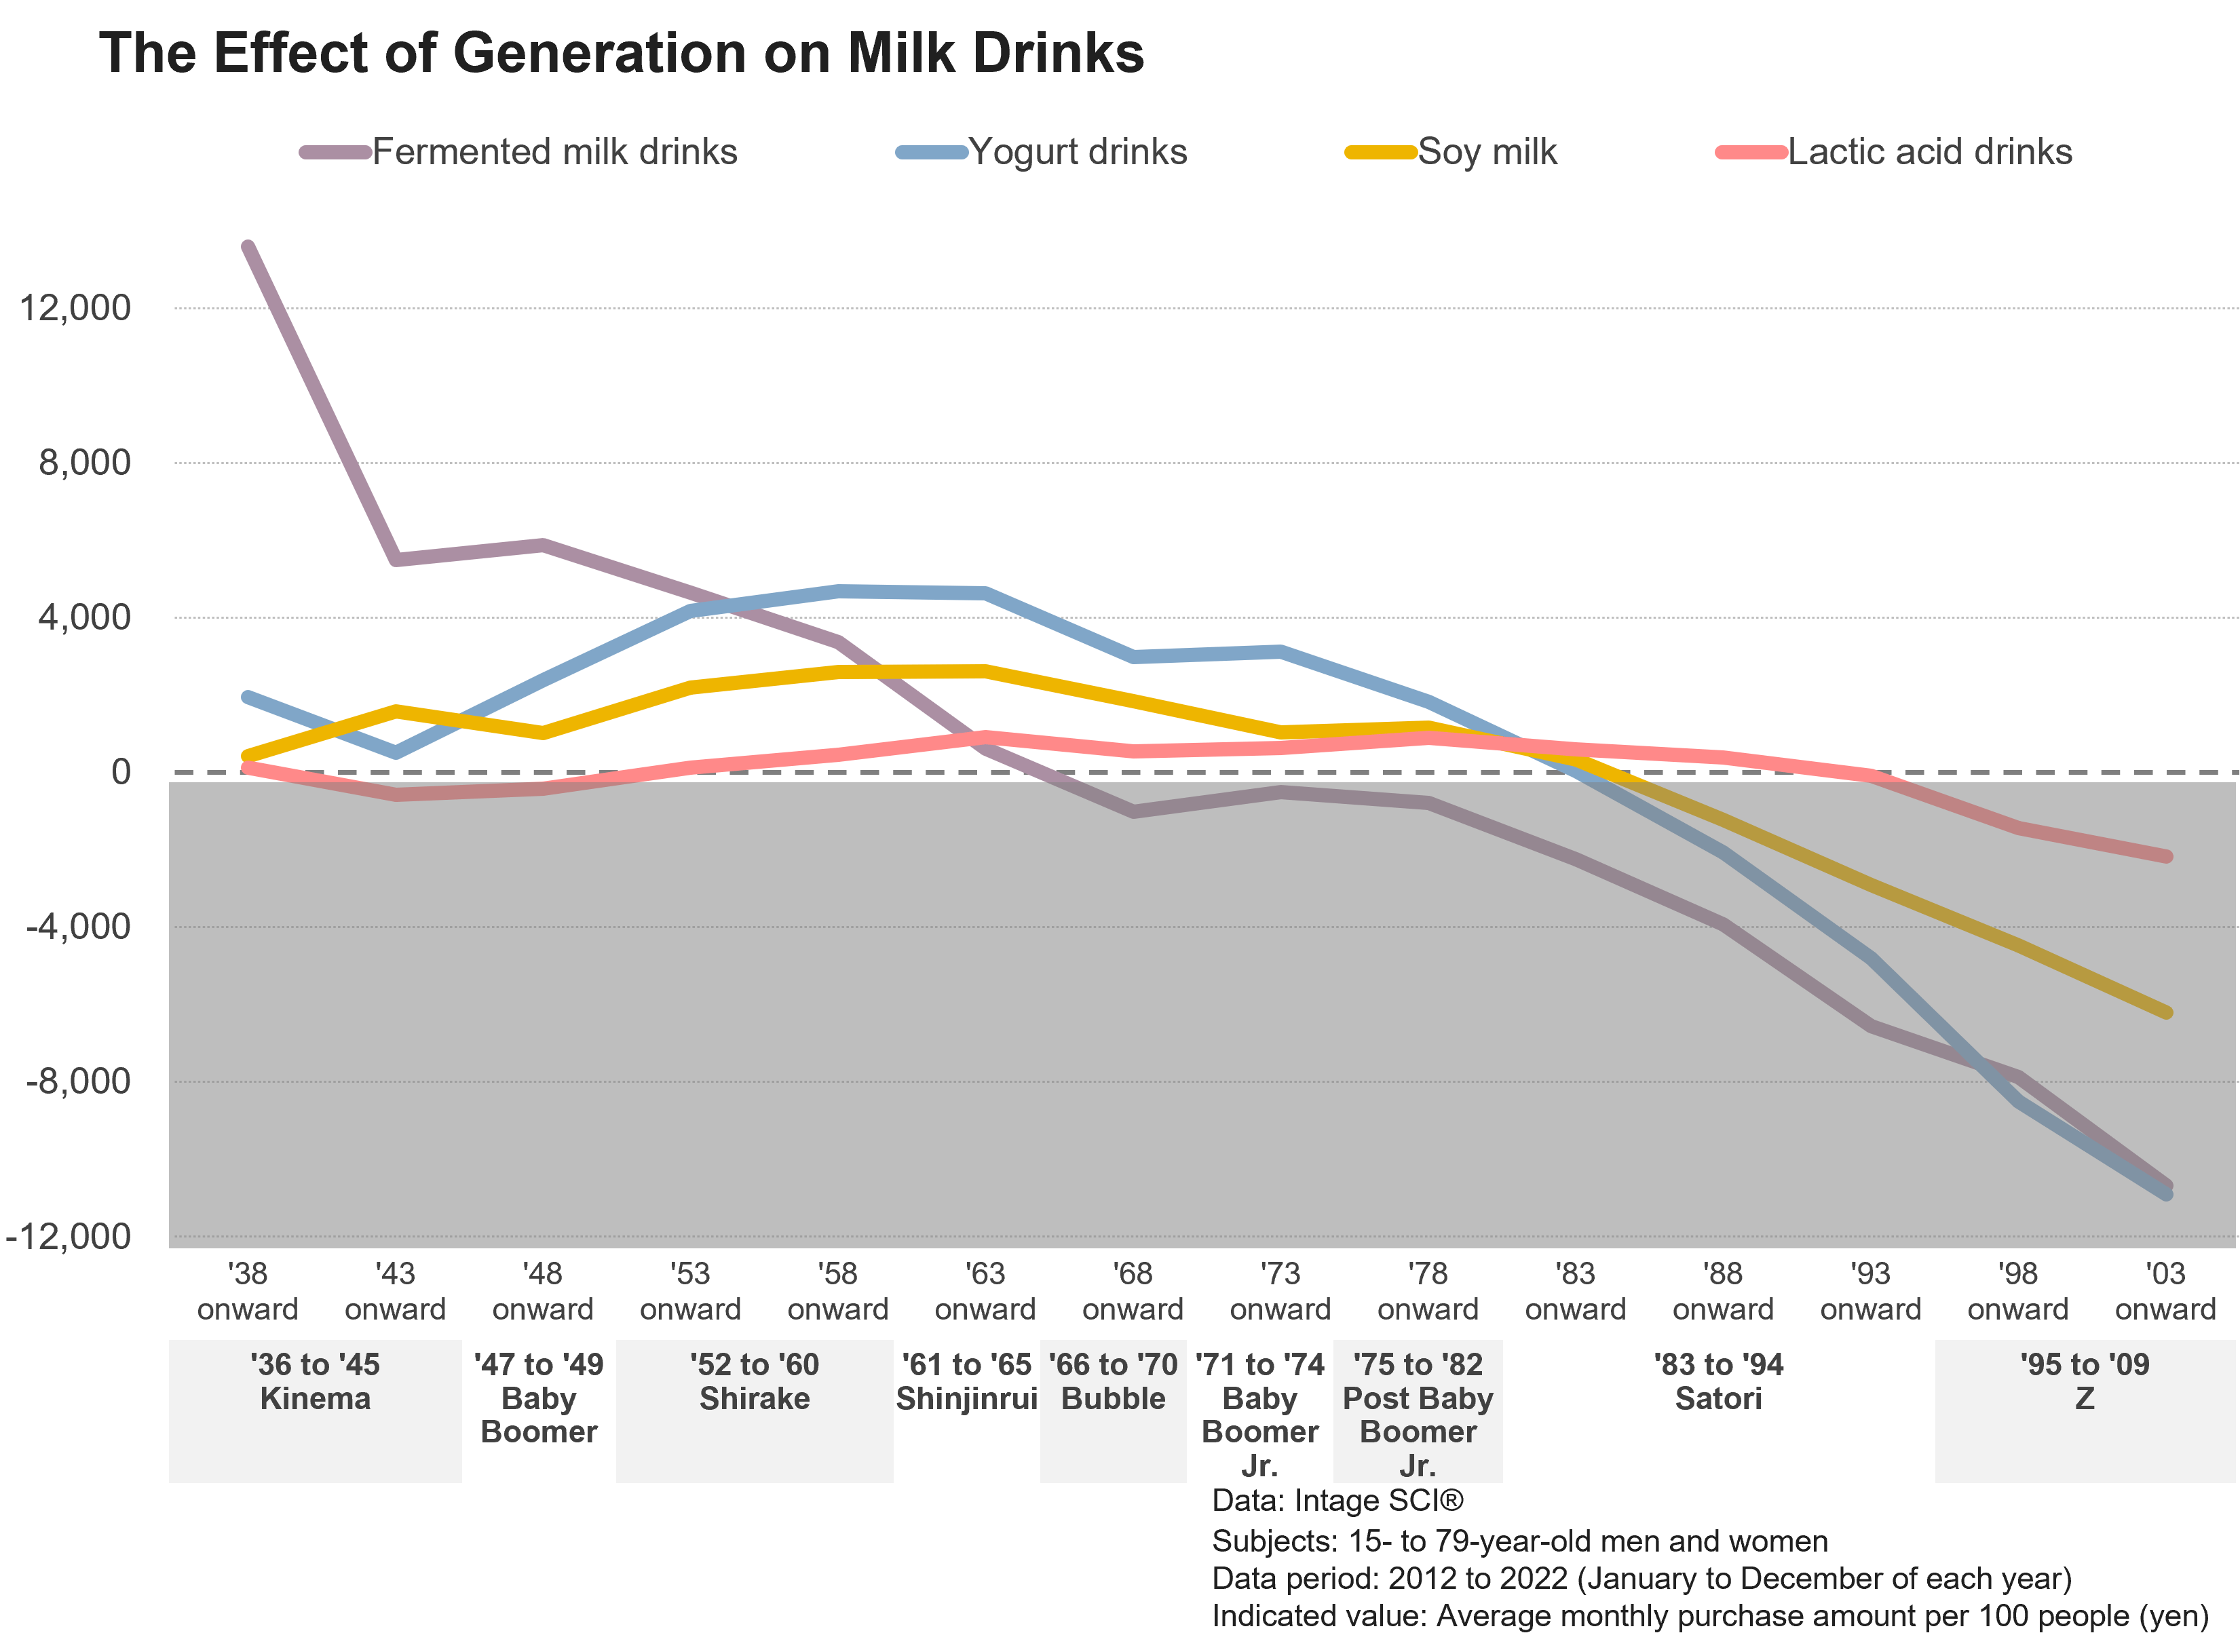
Fig.5 is a graph showing the effect of generation on four categories: fermented milk drinks, yogurt drinks, lactic acid drinks, and soy milk.
Fig.5
• “Fermented milk drinks (Yakult, R-1, Pilkul, etc.)” are supported by the Kinema generation born from 1936 to 1945 • “Yogurt drinks” and “soy milk” are supported by the Shirake generation born from 1952 and 1960 and the Shinjinrui generation born from 1961 to 1965 • “Lactic acid drinks (such as Calpis and iMuse)” show small generational effects, but if anything they are supported by a wide range of generations, from the Shinjinrui generation born from 1961 to 1965 to the Post Baby Boomer Jr. generation born from 1975 to 1982 As we saw with sweets, these results were influenced by the time period and consumers’ ages at the time.
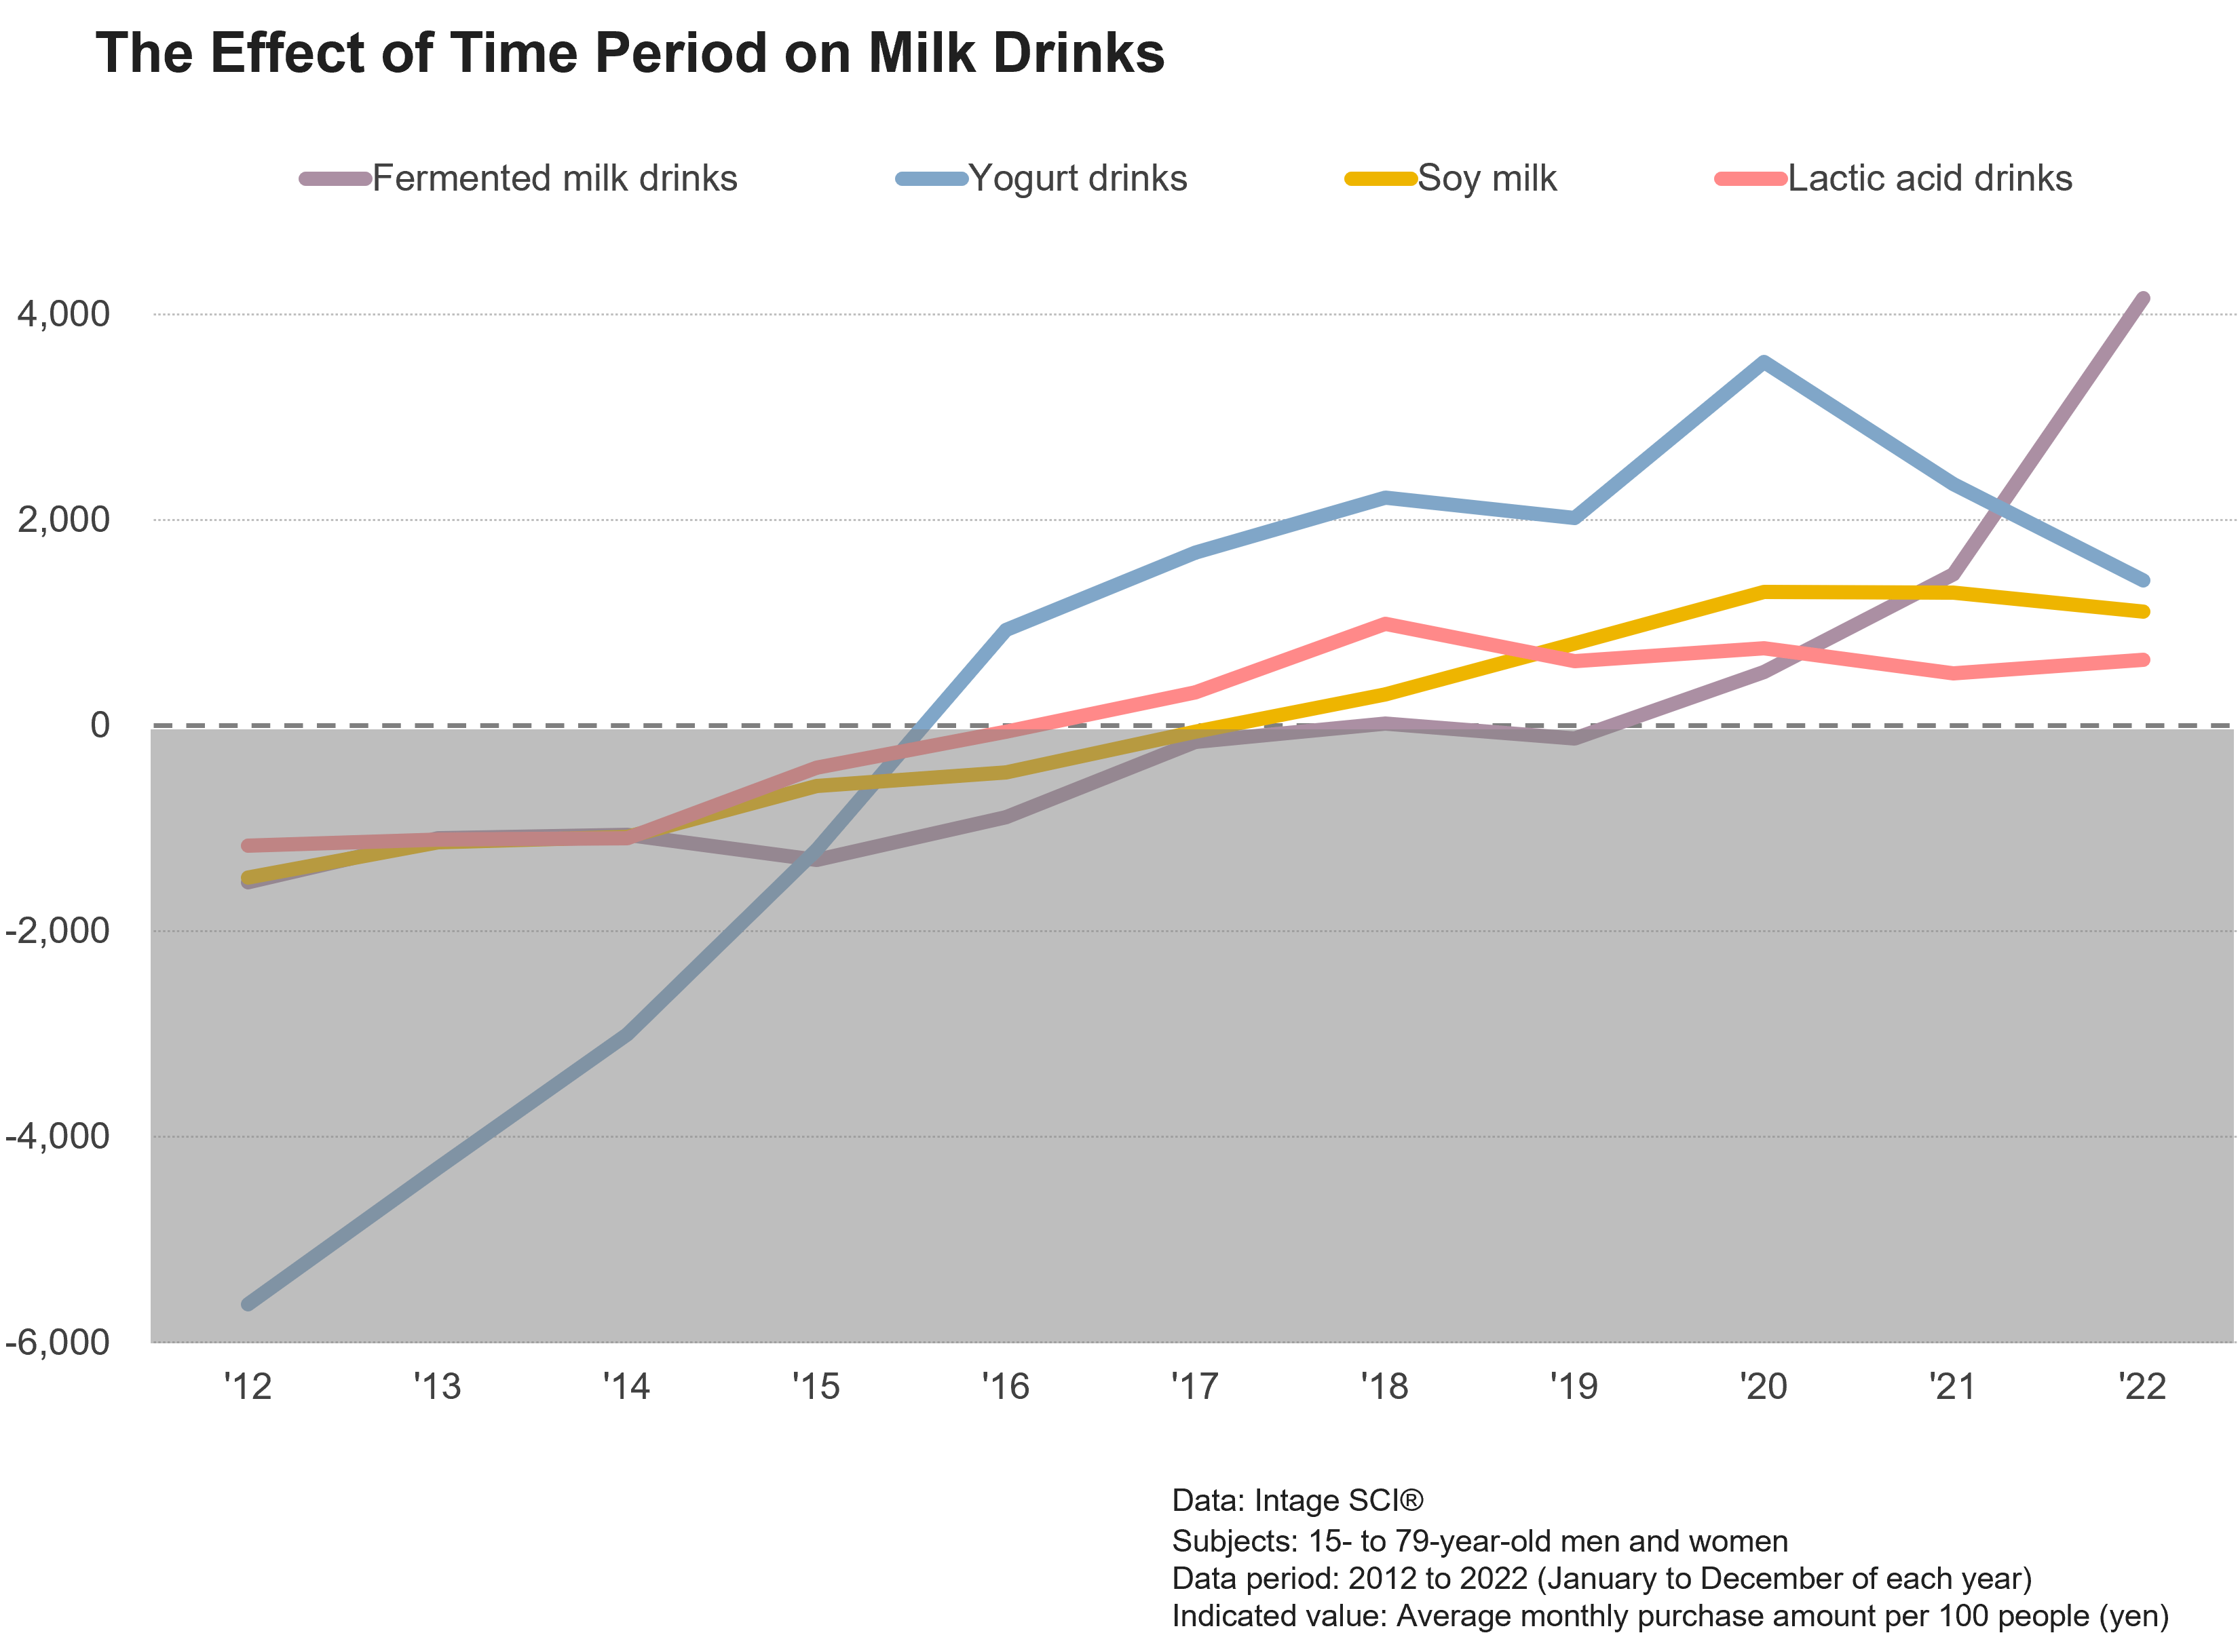
Fig.6 is a graph showing the effect of time period on the four categories.
Fig.6
• “Fermented milk drinks” turned positive in 2020 and have since surged due to the impact of extraordinary hit products • “Yogurt drinks” increased continuously starting in 2012, but decreased from a peak in 2020 due to the impact of fermented milk drinks • “Soy milk” increased continuously starting in 2012, but has remained flat since 2020 • “Lactic acid drinks” also increased continuously starting in 2012, but have remained flat since 2018
If we look at generation and time period together, we can see that yogurt drinks are performing poorly, whereas fermented milk drinks are doing well.
Behind the strong performance of fermented milk drinks, there seems to a sense of stagnation caused by a stressful society, which was intensified by the Covid-19 pandemic. Some people got sick because their daily activity decreased or the rhythm of their life was disturbed. It seems that more people seek to be in better physical condition on a daily basis to prevent illness. The result has been strong sales of Foods with Function Claims with added health benefits, such as boosting immunity, enhancing sleep quality, relieving stress, and improving the intestinal environment.
In terms of substitutability, the switch from the traditional “animal-based” categories to “plant-based,” including almond milk and oat milk in addition to soy milk, seemed to be accelerating further, but this trend appears to calmed down.
The Case of Types of Beer
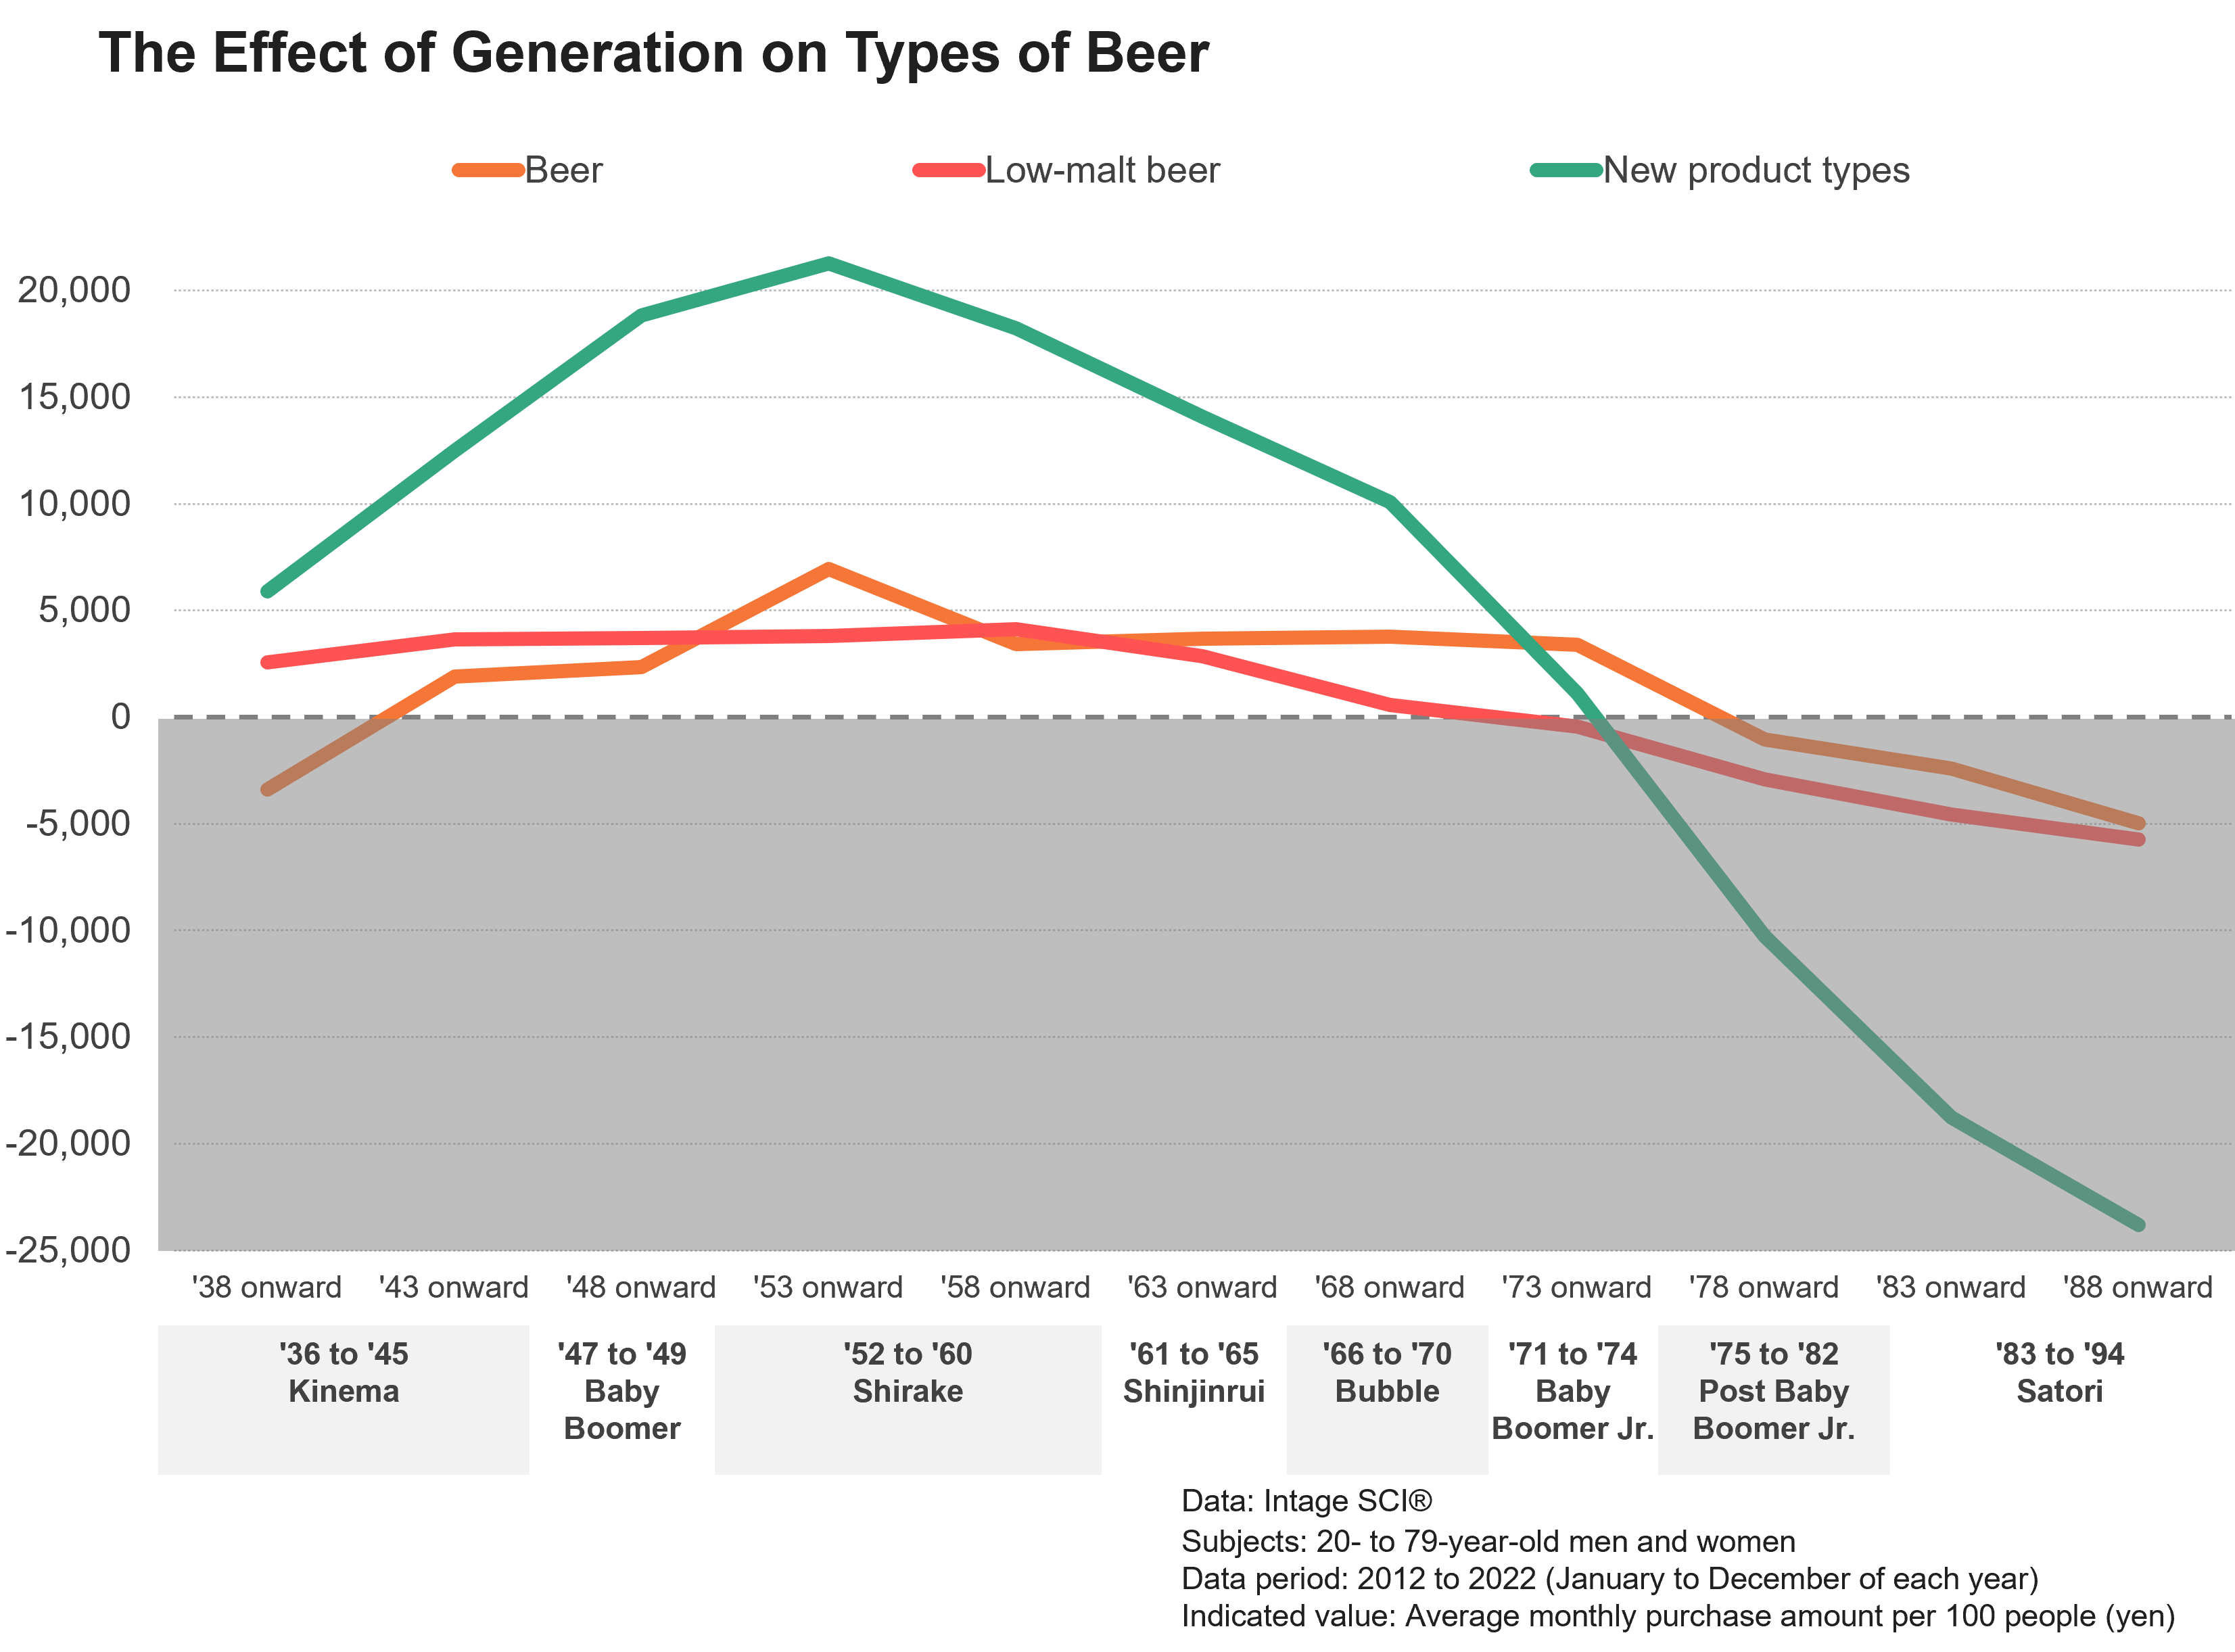
Fig.7 is a graph showing the effect of generation on three beer categories: beer, low-malt beer, and new product types.
Fig.7
All types of beer are commonly purchased by Baby Boomers, born from 1947 to 1949, and the Shirake generation, born from 1952 to 1960. It is evident that all types of beer are more popular with the generation that created the present Japan with reconstruction and rapid economic growth after World War II.
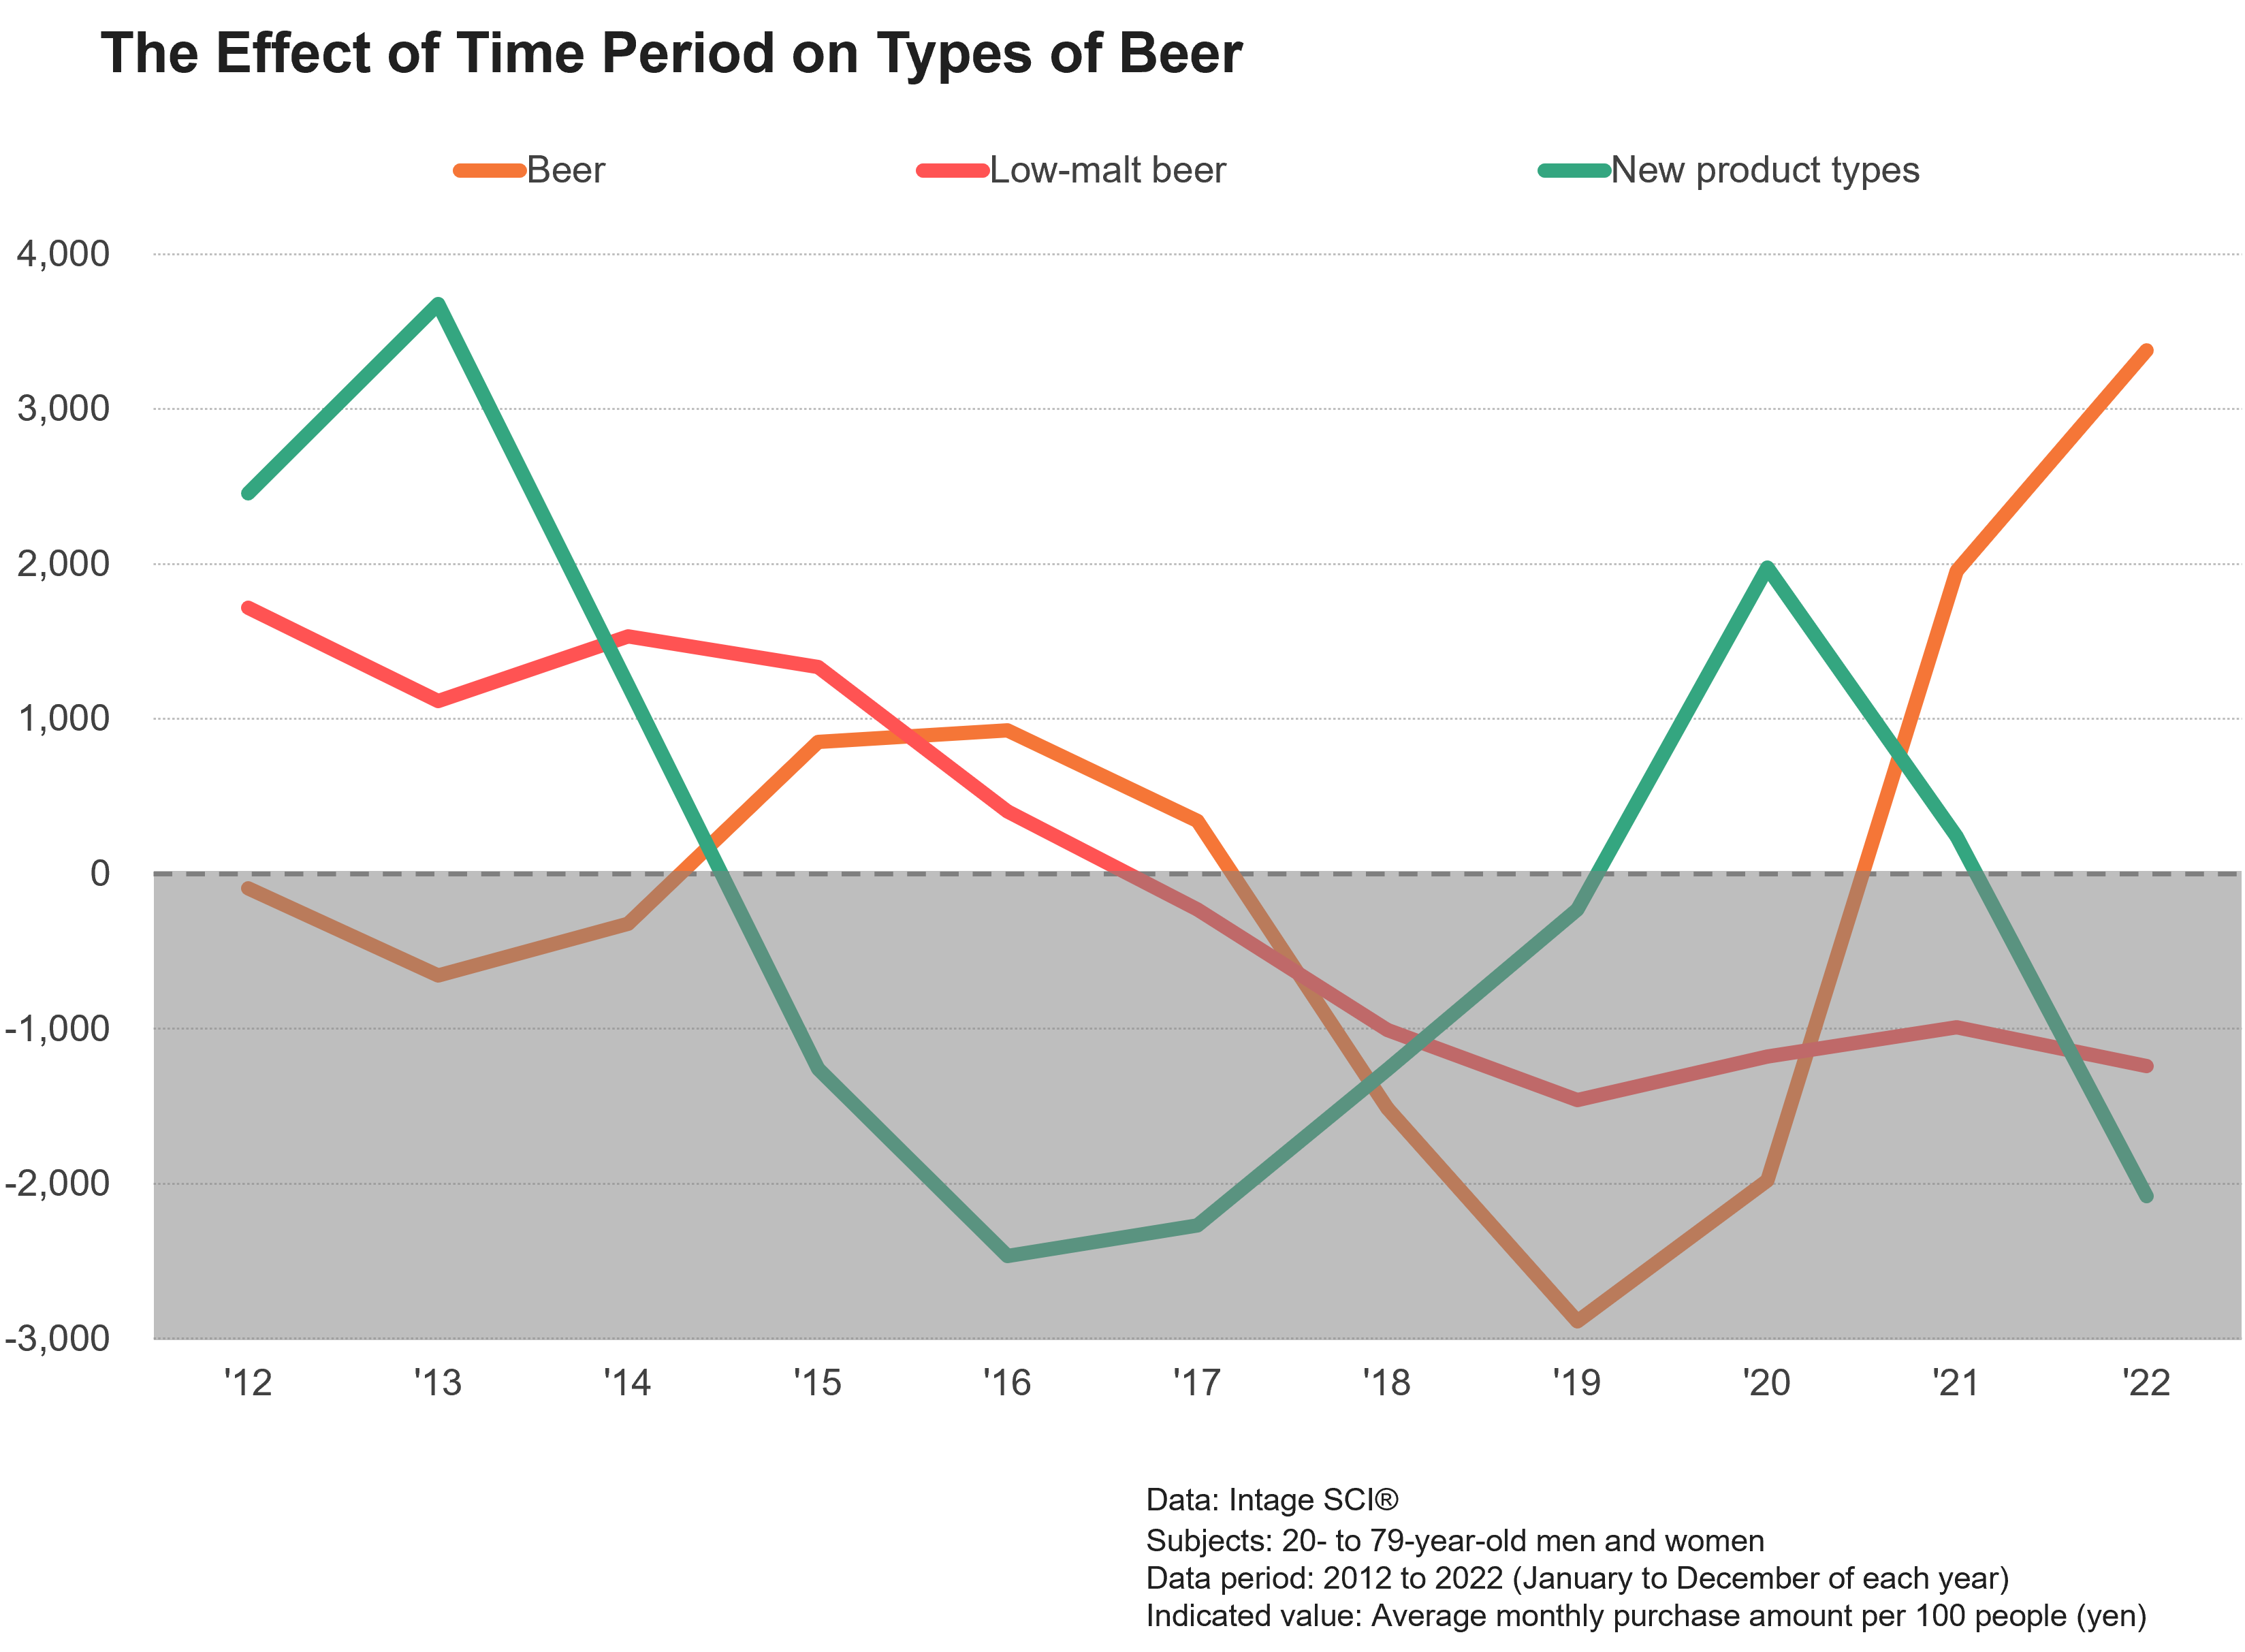
Fig.8 is a graph showing the effect of time period on three categories of types of beer.
Fig.8
• In 2013, “new product types” peaked as each beer company introduced new entries in this category • From 2015 to 2016, “beer” surged due to strong sales of premium beer • Hit products led “new product types” from 2018 to 2019 and accelerated due to the Covid-19 pandemic in 2020 • Due to a revision of the alcohol tax in October 2020, “beer” has soared since 2021 while “new product types” have plummeted • “Low-malt beer” fell continuously for a long time from 2012 to 2022 Combining the effects of generation and time period, we can see that the categories that are doing well have switched.
Behind the switch was a decline in disposable income as a result of the economic stagnation known as Japan’s “Lost 30 Years” and the ever-increasing “national burden rate” (the sum of the tax and social security burden rates). As a result, the thrift consciousness that had continued for a long time increased due to the Covid-19 pandemic, and people who drank types of beer for dinner as a daily pleasure took a closer look at cost-performance than ever before. Especially since 2021, the price adjustments due to the revision of the alcohol tax show that “beer” is considered to have better cost performance than “new product types.”
In this article, we used the results of a cohort analysis to disentangle the changes in the effects of generation and time period among highly substitutable categories to provide support for the changes occurring in the market. Breaking it down into three effects elucidates quantitatively what one may have only somehow sensed, including the surrounding categories, or new awareness may be enabled by interpreting the data in light of other events and background information in addition to the three effects. We believe readers will notice the advantages of this method.
For the 156 food + beverage + alcohol categories, we have already prepared market forecasts for 2030 in addition to the results of our cohort analysis. If you are interested, please speak with a sales representative at Intage.
*1SCI® (Nationwide Consumer Panel Survey) Data collected from 50,000 men and women aged 15~79 nationwide on their purchases of consumer goods to which JAN codes are assigned.
Ikuo Tsuruta, Top Analysis Designer, Business Design Department, Customer Business Drive Headquarters, Intage Inc.
Since joining Intage Inc., he has been responsible for developing solutions and analysis menus in all areas of research and analysis, including panel, ad hoc, data science, and consulting. In addition, he has been involved in project-based marketing support and analysis for a wide range of industries and over 150 companies.
Since joining Intage Inc., he has been responsible for developing solutions and analysis menus in all areas of research and analysis, including panel, ad hoc, data science, and consulting. In addition, he has been involved in project-based marketing support and analysis for a wide range of industries and over 150 companies.
Reproduction and Quotation
◆This report is copyrighted by INTAGE Inc. Please check the following prohibitions and precautions, and specify the source when reproducing or quoting this report. “Source: INTAGE “Knowledge Gallery” article published MM/DD/YYYY article”
◆The following are prohibited: ・Alteration of this article in full or in part ・Sale or publication of this article in full or in part ・Uses that are against public order and morality, and uses connected with illegal activities ・Reproducing or quoting panel data* for the purpose of advertising or promoting companies, products, or services *Panel data include: SRI+, SCI, SLI, Kitchen Diary, Car-kit, MAT-kit, Media Gauge, i-SSP, etc.
◆Other precautions: ・INTAGE Inc. shall not be liable for any trouble, loss, or damage caused by the use of this report ・These usage rules do not restrict the use of quotations or other uses permitted under the Copyright Act of Japan
◆For inquiries about reproduction and quotation, click here.